Copyright © 2010-2014 Linux Foundation
Permission is granted to copy, distribute and/or modify this document under the terms of the Creative Commons Attribution-Share Alike 2.0 UK: England & Wales as published by Creative Commons.
Note
For the latest version of this manual associated with this Yocto Project release, see the Yocto Project Profiling and Tracing Manual from the Yocto Project website.| Revision History | |
|---|---|
| Revision 1.4 | April 2013 |
| Released with the Yocto Project 1.4 Release. | |
| Revision 1.5 | October 2013 |
| Released with the Yocto Project 1.5 Release. | |
| Revision 1.5.1 | January 2014 |
| Released with the Yocto Project 1.5.1 Release. | |
Table of Contents
- 1. Yocto Project Tracing and Profiling Manual
- 2. Overall Architecture of the Linux Tracing and Profiling Tools
- 3. Basic Usage (with examples) for each of the Yocto Tracing Tools
- 4. Real-World Examples
Table of Contents
Yocto bundles a number of tracing and profiling tools - this 'HOWTO' describes their basic usage and shows by example how to make use of them to examine application and system behavior.
The tools presented are for the most part completely open-ended and have quite good and/or extensive documentation of their own which can be used to solve just about any problem you might come across in Linux. Each section that describes a particular tool has links to that tool's documentation and website.
The purpose of this 'HOWTO' is to present a set of common and generally useful tracing and profiling idioms along with their application (as appropriate) to each tool, in the context of a general-purpose 'drill-down' methodology that can be applied to solving a large number (90%?) of problems. For help with more advanced usages and problems, please see the documentation and/or websites listed for each tool.
The final section of this 'HOWTO' is a collection of real-world examples which we'll be continually adding to as we solve more problems using the tools - feel free to add your own examples to the list!
Most of the tools are available only in 'sdk' images or in images built after adding 'tools-profile' to your local.conf. So, in order to be able to access all of the tools described here, please first build and boot an 'sdk' image e.g.
$ bitbake core-image-sato-sdk
or alternatively by adding 'tools-profile' to the EXTRA_IMAGE_FEATURES line in your local.conf:
EXTRA_IMAGE_FEATURES = "debug-tweaks tools-profile"
If you use the 'tools-profile' method, you don't need to build an sdk image - the tracing and profiling tools will be included in non-sdk images as well e.g.:
$ bitbake core-image-sato
Note
By default, the Yocto build system strips symbols from the binaries it packages, which makes it difficult to use some of the tools.
You can prevent that by putting the following in your local.conf when you build the image:
INHIBIT_PACKAGE_STRIP = "1"
The above setting will noticeably increase the size of your image.
If you've already built a stripped image, you can generate debug packages (xxx-dbg) which you can manually install as needed.
To generate debug info for packages, you can add dbg-pkgs to EXTRA_IMAGE_FEATURES in local.conf. For example:
EXTRA_IMAGE_FEATURES = "debug-tweaks tools-profile dbg-pkgs"
Additionally, in order to generate the right type of debuginfo, we also need to add the following to local.conf:
PACKAGE_DEBUG_SPLIT_STYLE = 'debug-file-directory'
Table of Contents
It may seem surprising to see a section covering an 'overall architecture' for what seems to be a random collection of tracing tools that together make up the Linux tracing and profiling space. The fact is, however, that in recent years this seemingly disparate set of tools has started to converge on a 'core' set of underlying mechanisms:
- static tracepoints
- dynamic tracepoints
- kprobes
- uprobes
- the perf_events subsystem
- debugfs
Table of Contents
This chapter presents basic usage examples for each of the tracing tools.
The 'perf' tool is the profiling and tracing tool that comes bundled with the Linux kernel.
Don't let the fact that it's part of the kernel fool you into thinking that it's only for tracing and profiling the kernel - you can indeed use it to trace and profile just the kernel, but you can also use it to profile specific applications separately (with or without kernel context), and you can also use it to trace and profile the kernel and all applications on the system simultaneously to gain a system-wide view of what's going on.
In many ways, perf aims to be a superset of all the tracing and profiling tools available in Linux today, including all the other tools covered in this HOWTO. The past couple of years have seen perf subsume a lot of the functionality of those other tools and, at the same time, those other tools have removed large portions of their previous functionality and replaced it with calls to the equivalent functionality now implemented by the perf subsystem. Extrapolation suggests that at some point those other tools will simply become completely redundant and go away; until then, we'll cover those other tools in these pages and in many cases show how the same things can be accomplished in perf and the other tools when it seems useful to do so.
The coverage below details some of the most common ways you'll likely want to apply the tool; full documentation can be found either within the tool itself or in the man pages at perf(1).
For this section, we'll assume you've already performed the basic setup outlined in the General Setup section.
In particular, you'll get the most mileage out of perf if you profile an image built with INHIBIT_PACKAGE_STRIP = "1" in your local.conf.
perf runs on the target system for the most part. You can archive profile data and copy it to the host for analysis, but for the rest of this document we assume you've ssh'ed to the host and will be running the perf commands on the target.
The perf tool is pretty much self-documenting. To remind yourself of the available commands, simply type 'perf', which will show you basic usage along with the available perf subcommands:
     root@crownbay:~# perf

     usage: perf [--version] [--help] COMMAND [ARGS]

     The most commonly used perf commands are:
       annotate        Read perf.data (created by perf record) and display annotated code
       archive         Create archive with object files with build-ids found in perf.data file
       bench           General framework for benchmark suites
       buildid-cache   Manage build-id cache.
       buildid-list    List the buildids in a perf.data file
       diff            Read two perf.data files and display the differential profile
       evlist          List the event names in a perf.data file
       inject          Filter to augment the events stream with additional information
       kmem            Tool to trace/measure kernel memory(slab) properties
       kvm             Tool to trace/measure kvm guest os
       list            List all symbolic event types
       lock            Analyze lock events
       probe           Define new dynamic tracepoints
       record          Run a command and record its profile into perf.data
       report          Read perf.data (created by perf record) and display the profile
       sched           Tool to trace/measure scheduler properties (latencies)
       script          Read perf.data (created by perf record) and display trace output
       stat            Run a command and gather performance counter statistics
       test            Runs sanity tests.
       timechart       Tool to visualize total system behavior during a workload
       top             System profiling tool.

     See 'perf help COMMAND' for more information on a specific command.
As a simple test case, we'll profile the 'wget' of a fairly large file, which is a minimally interesting case because it has both file and network I/O aspects, and at least in the case of standard Yocto images, it's implemented as part of busybox, so the methods we use to analyze it can be used in a very similar way to the whole host of supported busybox applets in Yocto.
     root@crownbay:~# rm linux-2.6.19.2.tar.bz2; \
     wget http://downloads.yoctoproject.org/mirror/sources/linux-2.6.19.2.tar.bz2
The quickest and easiest way to get some basic overall data about what's going on for a particular workload is to profile it using 'perf stat'. 'perf stat' basically profiles using a few default counters and displays the summed counts at the end of the run:
     root@crownbay:~# perf stat wget http://downloads.yoctoproject.org/mirror/sources/linux-2.6.19.2.tar.bz2
     Connecting to downloads.yoctoproject.org (140.211.169.59:80)
     linux-2.6.19.2.tar.b 100% |***************************************************| 41727k  0:00:00 ETA

     Performance counter stats for 'wget http://downloads.yoctoproject.org/mirror/sources/linux-2.6.19.2.tar.bz2':

           4597.223902 task-clock                #    0.077 CPUs utilized
                 23568 context-switches          #    0.005 M/sec
                    68 CPU-migrations            #    0.015 K/sec
                   241 page-faults               #    0.052 K/sec
            3045817293 cycles                    #    0.663 GHz
       <not supported> stalled-cycles-frontend
       <not supported> stalled-cycles-backend
             858909167 instructions              #    0.28  insns per cycle
             165441165 branches                  #   35.987 M/sec
              19550329 branch-misses             #   11.82% of all branches

          59.836627620 seconds time elapsed
Many times such a simple-minded test doesn't yield much of interest, but sometimes it does (see Real-world Yocto bug (slow loop-mounted write speed)).
Also, note that 'perf stat' isn't restricted to a fixed set of counters - basically any event listed in the output of 'perf list' can be tallied by 'perf stat'. For example, suppose we wanted to see a summary of all the events related to kernel memory allocation/freeing along with cache hits and misses:
     root@crownbay:~# perf stat -e kmem:* -e cache-references -e cache-misses wget http://downloads.yoctoproject.org/mirror/sources/linux-2.6.19.2.tar.bz2
     Connecting to downloads.yoctoproject.org (140.211.169.59:80)
     linux-2.6.19.2.tar.b 100% |***************************************************| 41727k  0:00:00 ETA

     Performance counter stats for 'wget http://downloads.yoctoproject.org/mirror/sources/linux-2.6.19.2.tar.bz2':

                  5566 kmem:kmalloc
                125517 kmem:kmem_cache_alloc
                     0 kmem:kmalloc_node
                     0 kmem:kmem_cache_alloc_node
                 34401 kmem:kfree
                 69920 kmem:kmem_cache_free
                   133 kmem:mm_page_free
                    41 kmem:mm_page_free_batched
                 11502 kmem:mm_page_alloc
                 11375 kmem:mm_page_alloc_zone_locked
                     0 kmem:mm_page_pcpu_drain
                     0 kmem:mm_page_alloc_extfrag
              66848602 cache-references
               2917740 cache-misses              #    4.365 % of all cache refs

          44.831023415 seconds time elapsed
So 'perf stat' gives us a nice easy way to get a quick overview of what might be happening for a set of events, but normally we'd need a little more detail in order to understand what's going on in a way that we can act on in a useful way.
To dive down into a next level of detail, we can use 'perf record'/'perf report' which will collect profiling data and present it to use using an interactive text-based UI (or simply as text if we specify --stdio to 'perf report').
As our first attempt at profiling this workload, we'll simply run 'perf record', handing it the workload we want to profile (everything after 'perf record' and any perf options we hand it - here none - will be executed in a new shell). perf collects samples until the process exits and records them in a file named 'perf.data' in the current working directory.
     root@crownbay:~# perf record wget http://downloads.yoctoproject.org/mirror/sources/linux-2.6.19.2.tar.bz2

     Connecting to downloads.yoctoproject.org (140.211.169.59:80)
     linux-2.6.19.2.tar.b 100% |************************************************| 41727k  0:00:00 ETA
     [ perf record: Woken up 1 times to write data ]
     [ perf record: Captured and wrote 0.176 MB perf.data (~7700 samples) ]
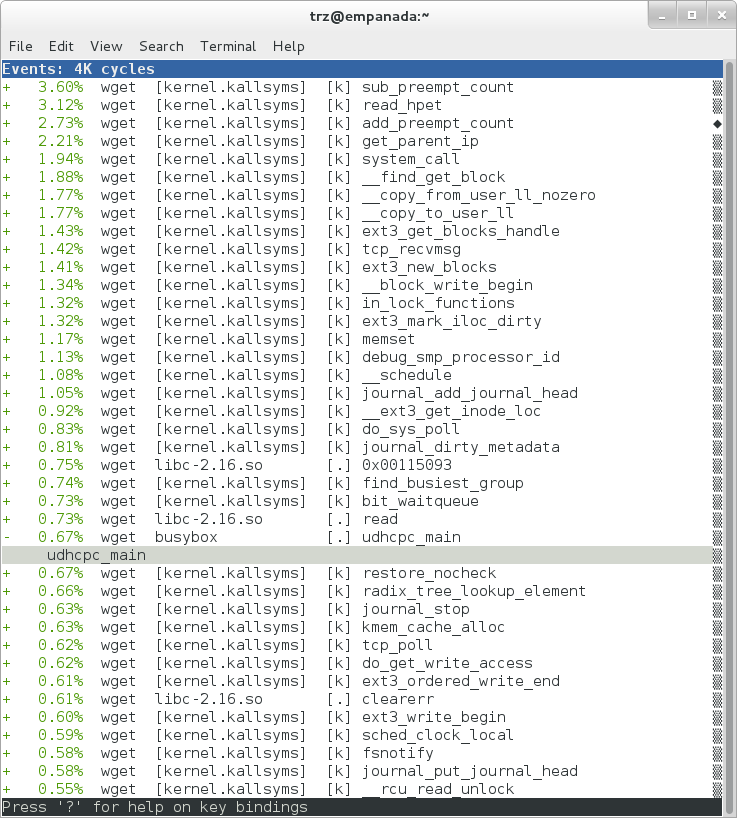
To see the results in a 'text-based UI' (tui), simply run 'perf report', which will read the perf.data file in the current working directory and display the results in an interactive UI:
root@crownbay:~# perf report
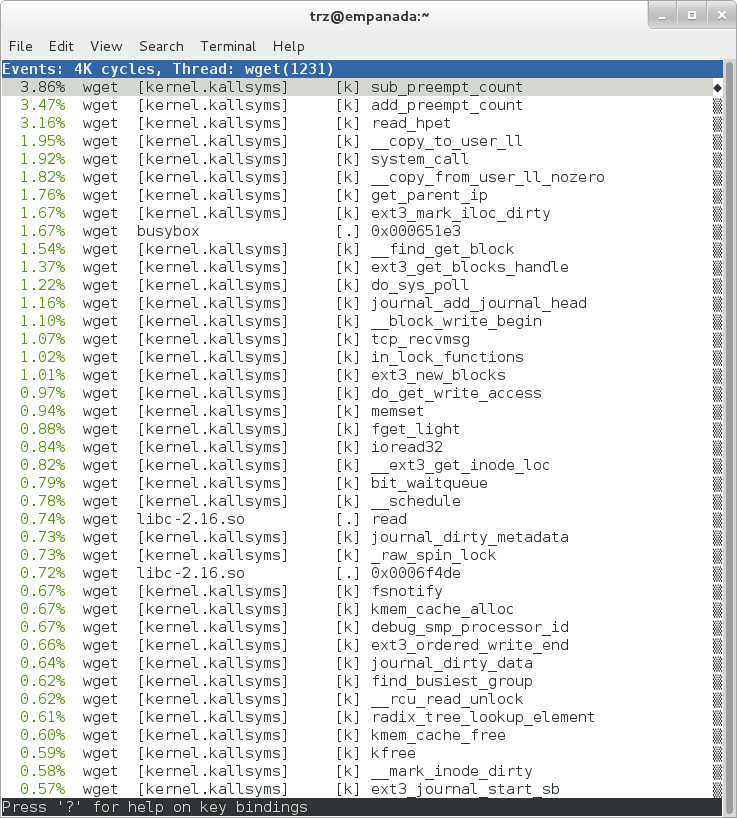 |
The above screenshot displays a 'flat' profile, one entry for each 'bucket' corresponding to the functions that were profiled during the profiling run, ordered from the most popular to the least (perf has options to sort in various orders and keys as well as display entries only above a certain threshold and so on - see the perf documentation for details). Note that this includes both userspace functions (entries containing a [.]) and kernel functions accounted to the process (entries containing a [k]). (perf has command-line modifiers that can be used to restrict the profiling to kernel or userspace, among others).
Notice also that the above report shows an entry for 'busybox', which is the executable that implements 'wget' in Yocto, but that instead of a useful function name in that entry, it displays a not-so-friendly hex value instead. The steps below will show how to fix that problem.
Before we do that, however, let's try running a different profile, one which shows something a little more interesting. The only difference between the new profile and the previous one is that we'll add the -g option, which will record not just the address of a sampled function, but the entire callchain to the sampled function as well:
root@crownbay:~# perf record -g wget http://downloads.yoctoproject.org/mirror/sources/linux-2.6.19.2.tar.bz2
Connecting to downloads.yoctoproject.org (140.211.169.59:80)
linux-2.6.19.2.tar.b 100% |************************************************| 41727k 0:00:00 ETA
[ perf record: Woken up 3 times to write data ]
[ perf record: Captured and wrote 0.652 MB perf.data (~28476 samples) ]
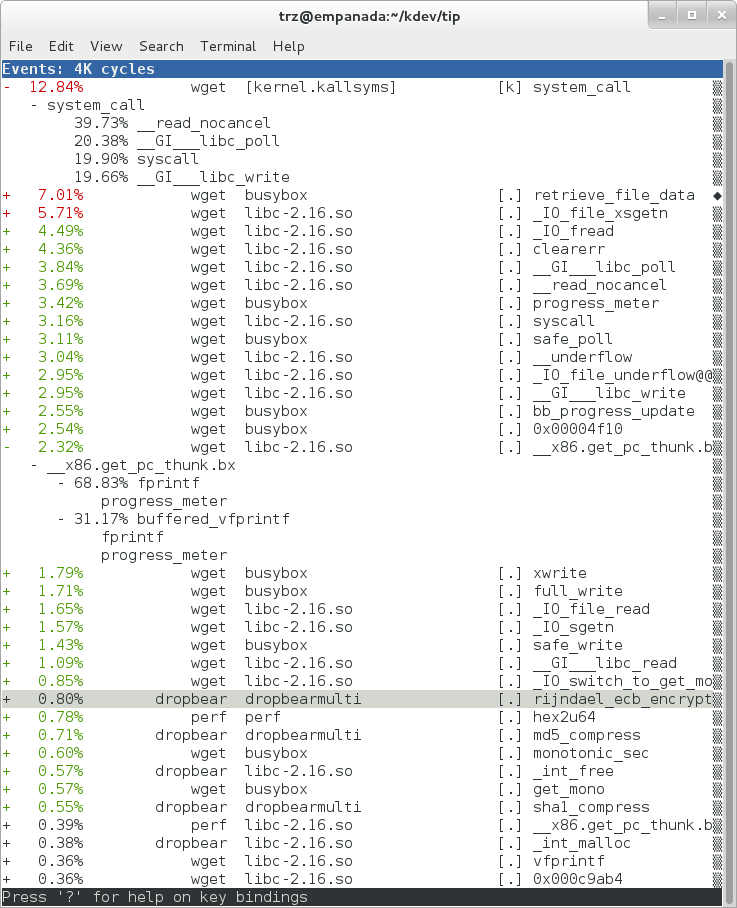
root@crownbay:~# perf report
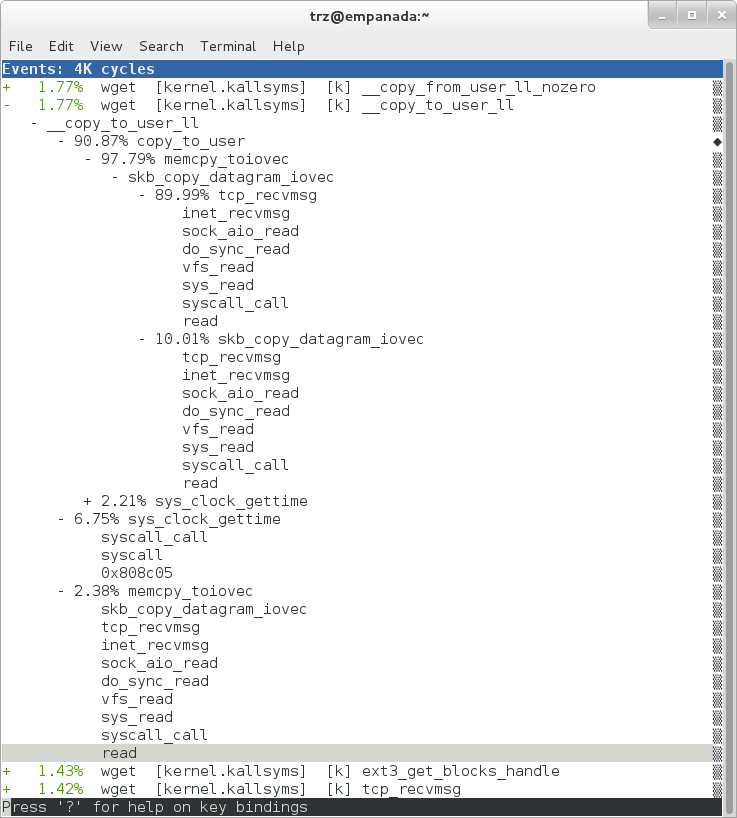 |
Using the callgraph view, we can actually see not only which functions took the most time, but we can also see a summary of how those functions were called and learn something about how the program interacts with the kernel in the process.
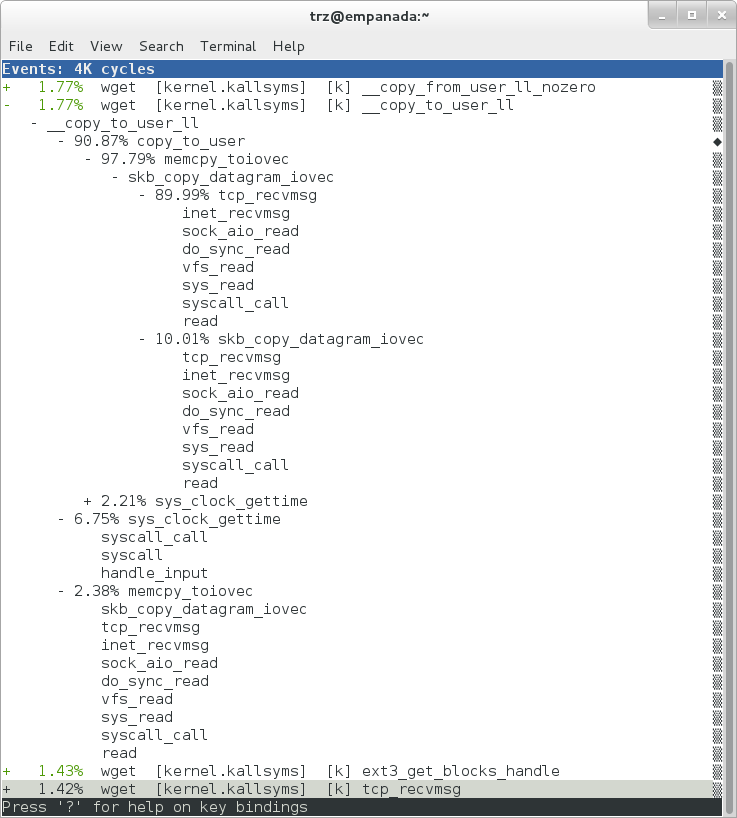
Notice that each entry in the above screenshot now contains a '+' on the left-hand side. This means that we can expand the entry and drill down into the callchains that feed into that entry. Pressing 'enter' on any one of them will expand the callchain (you can also press 'E' to expand them all at the same time or 'C' to collapse them all).
In the screenshot above, we've toggled the __copy_to_user_ll() entry and several subnodes all the way down. This lets us see which callchains contributed to the profiled __copy_to_user_ll() function which contributed 1.77% to the total profile.
As a bit of background explanation for these callchains, think about what happens at a high level when you run wget to get a file out on the network. Basically what happens is that the data comes into the kernel via the network connection (socket) and is passed to the userspace program 'wget' (which is actually a part of busybox, but that's not important for now), which takes the buffers the kernel passes to it and writes it to a disk file to save it.
The part of this process that we're looking at in the above call stacks is the part where the kernel passes the data it's read from the socket down to wget i.e. a copy-to-user.
Notice also that here there's also a case where the hex value is displayed in the callstack, here in the expanded sys_clock_gettime() function. Later we'll see it resolve to a userspace function call in busybox.
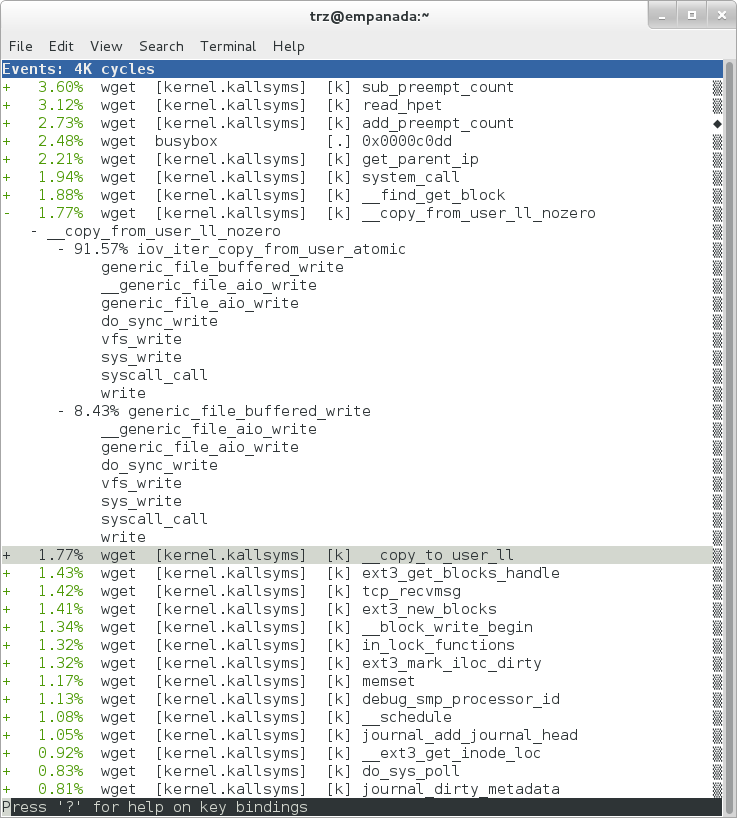 |
The above screenshot shows the other half of the journey for the data - from the wget program's userspace buffers to disk. To get the buffers to disk, the wget program issues a write(2), which does a copy-from-user to the kernel, which then takes care via some circuitous path (probably also present somewhere in the profile data), to get it safely to disk.
Now that we've seen the basic layout of the profile data and the basics of how to extract useful information out of it, let's get back to the task at hand and see if we can get some basic idea about where the time is spent in the program we're profiling, wget. Remember that wget is actually implemented as an applet in busybox, so while the process name is 'wget', the executable we're actually interested in is busybox. So let's expand the first entry containing busybox:
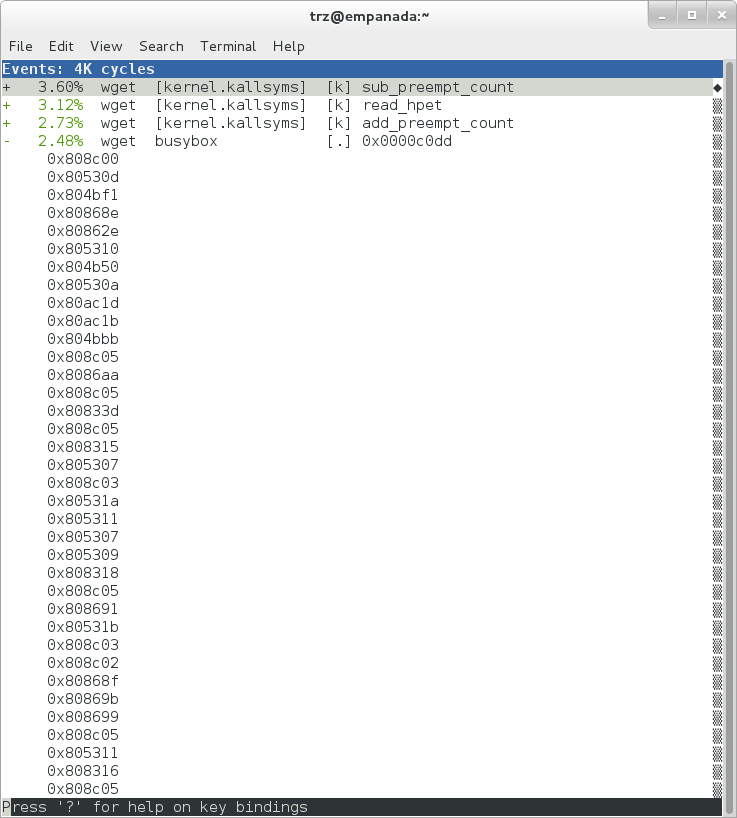 |
Again, before we expanded we saw that the function was labeled with a hex value instead of a symbol as with most of the kernel entries. Expanding the busybox entry doesn't make it any better.
The problem is that perf can't find the symbol information for the busybox binary, which is actually stripped out by the Yocto build system.
One way around that is to put the following in your local.conf when you build the image:
INHIBIT_PACKAGE_STRIP = "1"
However, we already have an image with the binaries stripped, so what can we do to get perf to resolve the symbols? Basically we need to install the debuginfo for the busybox package.
To generate the debug info for the packages in the image, we can add dbg-pkgs to EXTRA_IMAGE_FEATURES in local.conf. For example:
EXTRA_IMAGE_FEATURES = "debug-tweaks tools-profile dbg-pkgs"
Additionally, in order to generate the type of debuginfo that perf understands, we also need to add the following to local.conf:
PACKAGE_DEBUG_SPLIT_STYLE = 'debug-file-directory'
Once we've done that, we can install the debuginfo for busybox. The debug packages once built can be found in build/tmp/deploy/rpm/* on the host system. Find the busybox-dbg-...rpm file and copy it to the target. For example:
     [trz@empanada core2]$ scp /home/trz/yocto/crownbay-tracing-dbg/build/tmp/deploy/rpm/core2/busybox-dbg-1.20.2-r2.core2.rpm root@192.168.1.31:
     root@192.168.1.31's password:
     busybox-dbg-1.20.2-r2.core2.rpm                     100% 1826KB   1.8MB/s   00:01
Now install the debug rpm on the target:
root@crownbay:~# rpm -i busybox-dbg-1.20.2-r2.core2.rpm
Now that the debuginfo is installed, we see that the busybox entries now display their functions symbolically:
 |
If we expand one of the entries and press 'enter' on a leaf node, we're presented with a menu of actions we can take to get more information related to that entry:
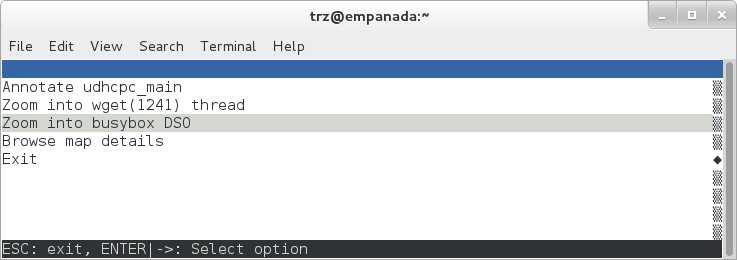 |
One of these actions allows us to show a view that displays a busybox-centric view of the profiled functions (in this case we've also expanded all the nodes using the 'E' key):
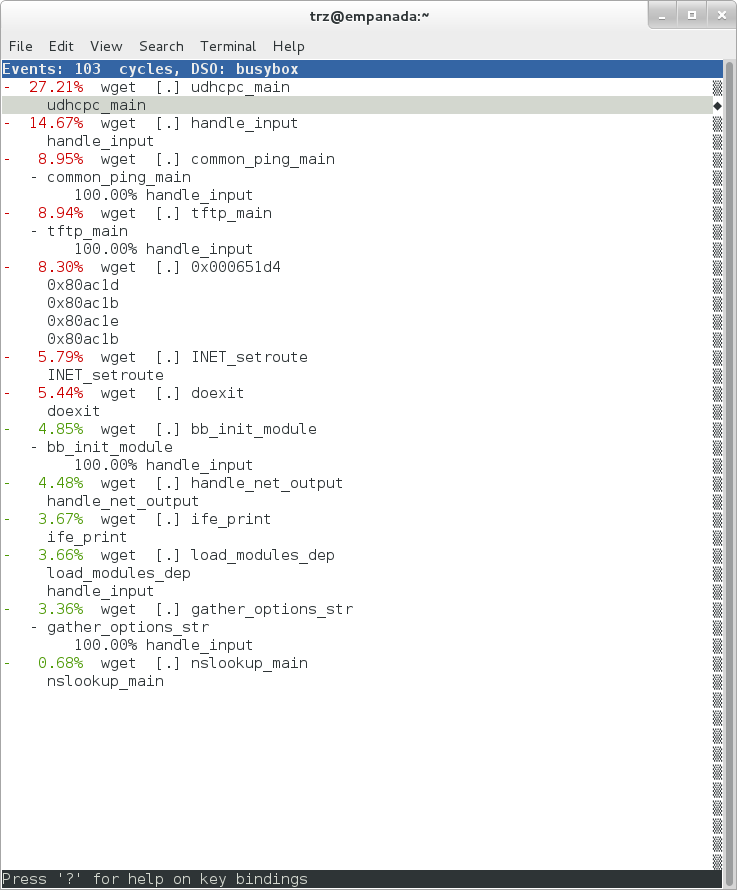 |
Finally, we can see that now that the busybox debuginfo is installed, the previously unresolved symbol in the sys_clock_gettime() entry mentioned previously is now resolved, and shows that the sys_clock_gettime system call that was the source of 6.75% of the copy-to-user overhead was initiated by the handle_input() busybox function:
 |
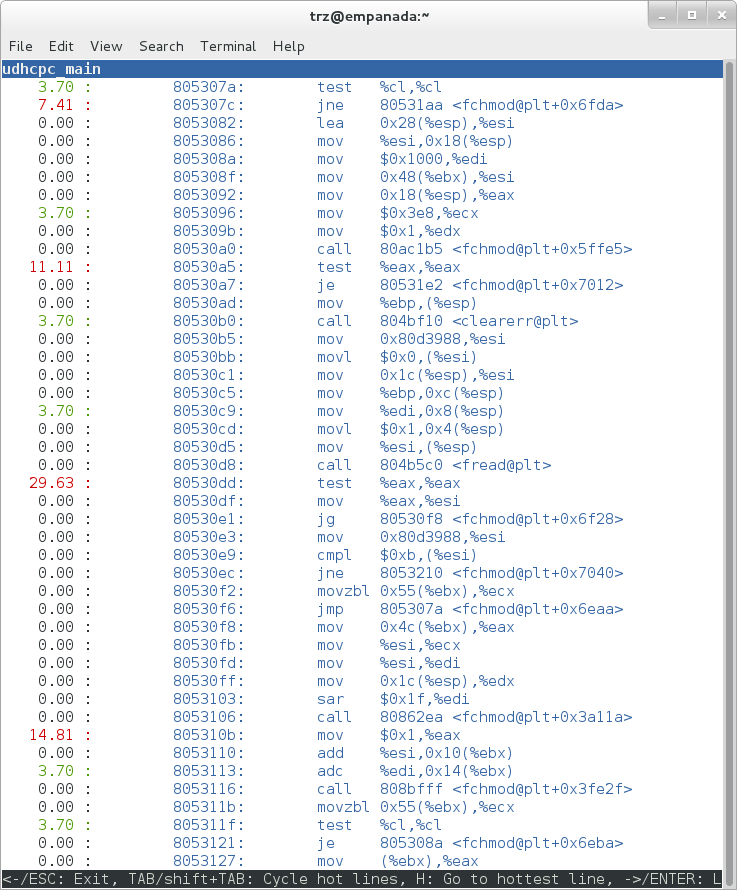
At the lowest level of detail, we can dive down to the assembly level and see which instructions caused the most overhead in a function. Pressing 'enter' on the 'udhcpc_main' function, we're again presented with a menu:
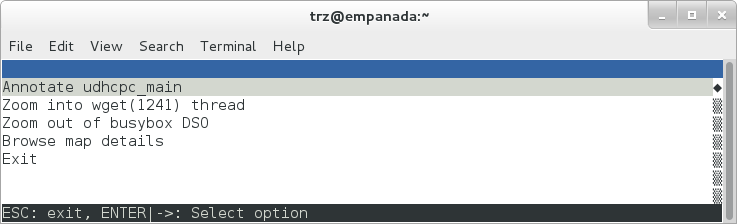 |
Selecting 'Annotate udhcpc_main', we get a detailed listing of percentages by instruction for the udhcpc_main function. From the display, we can see that over 50% of the time spent in this function is taken up by a couple tests and the move of a constant (1) to a register:
 |
As a segue into tracing, let's try another profile using a different counter, something other than the default 'cycles'.
The tracing and profiling infrastructure in Linux has become unified in a way that allows us to use the same tool with a completely different set of counters, not just the standard hardware counters that traditional tools have had to restrict themselves to (of course the traditional tools can also make use of the expanded possibilities now available to them, and in some cases have, as mentioned previously).
We can get a list of the available events that can be used to profile a workload via 'perf list':
     root@crownbay:~# perf list

     List of pre-defined events (to be used in -e):
      cpu-cycles OR cycles                               [Hardware event]
      stalled-cycles-frontend OR idle-cycles-frontend    [Hardware event]
      stalled-cycles-backend OR idle-cycles-backend      [Hardware event]
      instructions                                       [Hardware event]
      cache-references                                   [Hardware event]
      cache-misses                                       [Hardware event]
      branch-instructions OR branches                    [Hardware event]
      branch-misses                                      [Hardware event]
      bus-cycles                                         [Hardware event]
      ref-cycles                                         [Hardware event]

      cpu-clock                                          [Software event]
      task-clock                                         [Software event]
      page-faults OR faults                              [Software event]
      minor-faults                                       [Software event]
      major-faults                                       [Software event]
      context-switches OR cs                             [Software event]
      cpu-migrations OR migrations                       [Software event]
      alignment-faults                                   [Software event]
      emulation-faults                                   [Software event]

      L1-dcache-loads                                    [Hardware cache event]
      L1-dcache-load-misses                              [Hardware cache event]
      L1-dcache-prefetch-misses                          [Hardware cache event]
      L1-icache-loads                                    [Hardware cache event]
      L1-icache-load-misses                              [Hardware cache event]
      .
      .
      .
      rNNN                                               [Raw hardware event descriptor]
      cpu/t1=v1[,t2=v2,t3 ...]/modifier                  [Raw hardware event descriptor]
       (see 'perf list --help' on how to encode it)

      mem:<addr>[:access]                                [Hardware breakpoint]

      sunrpc:rpc_call_status                             [Tracepoint event]
      sunrpc:rpc_bind_status                             [Tracepoint event]
      sunrpc:rpc_connect_status                          [Tracepoint event]
      sunrpc:rpc_task_begin                              [Tracepoint event]
      skb:kfree_skb                                      [Tracepoint event]
      skb:consume_skb                                    [Tracepoint event]
      skb:skb_copy_datagram_iovec                        [Tracepoint event]
      net:net_dev_xmit                                   [Tracepoint event]
      net:net_dev_queue                                  [Tracepoint event]
      net:netif_receive_skb                              [Tracepoint event]
      net:netif_rx                                       [Tracepoint event]
      napi:napi_poll                                     [Tracepoint event]
      sock:sock_rcvqueue_full                            [Tracepoint event]
      sock:sock_exceed_buf_limit                         [Tracepoint event]
      udp:udp_fail_queue_rcv_skb                         [Tracepoint event]
      hda:hda_send_cmd                                   [Tracepoint event]
      hda:hda_get_response                               [Tracepoint event]
      hda:hda_bus_reset                                  [Tracepoint event]
      scsi:scsi_dispatch_cmd_start                       [Tracepoint event]
      scsi:scsi_dispatch_cmd_error                       [Tracepoint event]
      scsi:scsi_eh_wakeup                                [Tracepoint event]
      drm:drm_vblank_event                               [Tracepoint event]
      drm:drm_vblank_event_queued                        [Tracepoint event]
      drm:drm_vblank_event_delivered                     [Tracepoint event]
      random:mix_pool_bytes                              [Tracepoint event]
      random:mix_pool_bytes_nolock                       [Tracepoint event]
      random:credit_entropy_bits                         [Tracepoint event]
      gpio:gpio_direction                                [Tracepoint event]
      gpio:gpio_value                                    [Tracepoint event]
      block:block_rq_abort                               [Tracepoint event]
      block:block_rq_requeue                             [Tracepoint event]
      block:block_rq_issue                               [Tracepoint event]
      block:block_bio_bounce                             [Tracepoint event]
      block:block_bio_complete                           [Tracepoint event]
      block:block_bio_backmerge                          [Tracepoint event]
      .
      .
      writeback:writeback_wake_thread                    [Tracepoint event]
      writeback:writeback_wake_forker_thread             [Tracepoint event]
      writeback:writeback_bdi_register                   [Tracepoint event]
      .
      .
      writeback:writeback_single_inode_requeue           [Tracepoint event]
      writeback:writeback_single_inode                   [Tracepoint event]
      kmem:kmalloc                                       [Tracepoint event]
      kmem:kmem_cache_alloc                              [Tracepoint event]
      kmem:mm_page_alloc                                 [Tracepoint event]
      kmem:mm_page_alloc_zone_locked                     [Tracepoint event]
      kmem:mm_page_pcpu_drain                            [Tracepoint event]
      kmem:mm_page_alloc_extfrag                         [Tracepoint event]
      vmscan:mm_vmscan_kswapd_sleep                      [Tracepoint event]
      vmscan:mm_vmscan_kswapd_wake                       [Tracepoint event]
      vmscan:mm_vmscan_wakeup_kswapd                     [Tracepoint event]
      vmscan:mm_vmscan_direct_reclaim_begin              [Tracepoint event]
      .
      .
      module:module_get                                  [Tracepoint event]
      module:module_put                                  [Tracepoint event]
      module:module_request                              [Tracepoint event]
      sched:sched_kthread_stop                           [Tracepoint event]
      sched:sched_wakeup                                 [Tracepoint event]
      sched:sched_wakeup_new                             [Tracepoint event]
      sched:sched_process_fork                           [Tracepoint event]
      sched:sched_process_exec                           [Tracepoint event]
      sched:sched_stat_runtime                           [Tracepoint event]
      rcu:rcu_utilization                                [Tracepoint event]
      workqueue:workqueue_queue_work                     [Tracepoint event]
      workqueue:workqueue_execute_end                    [Tracepoint event]
      signal:signal_generate                             [Tracepoint event]
      signal:signal_deliver                              [Tracepoint event]
      timer:timer_init                                   [Tracepoint event]
      timer:timer_start                                  [Tracepoint event]
      timer:hrtimer_cancel                               [Tracepoint event]
      timer:itimer_state                                 [Tracepoint event]
      timer:itimer_expire                                [Tracepoint event]
      irq:irq_handler_entry                              [Tracepoint event]
      irq:irq_handler_exit                               [Tracepoint event]
      irq:softirq_entry                                  [Tracepoint event]
      irq:softirq_exit                                   [Tracepoint event]
      irq:softirq_raise                                  [Tracepoint event]
      printk:console                                     [Tracepoint event]
      task:task_newtask                                  [Tracepoint event]
      task:task_rename                                   [Tracepoint event]
      syscalls:sys_enter_socketcall                      [Tracepoint event]
      syscalls:sys_exit_socketcall                       [Tracepoint event]
      .
      .
      .
      syscalls:sys_enter_unshare                         [Tracepoint event]
      syscalls:sys_exit_unshare                          [Tracepoint event]
      raw_syscalls:sys_enter                             [Tracepoint event]
      raw_syscalls:sys_exit                              [Tracepoint event]
Only a subset of these would be of interest to us when looking at this workload, so let's choose the most likely subsystems (identified by the string before the colon in the Tracepoint events) and do a 'perf stat' run using only those wildcarded subsystems:
     root@crownbay:~# perf stat -e skb:* -e net:* -e napi:* -e sched:* -e workqueue:* -e irq:* -e syscalls:* wget http://downloads.yoctoproject.org/mirror/sources/linux-2.6.19.2.tar.bz2
     Performance counter stats for 'wget http://downloads.yoctoproject.org/mirror/sources/linux-2.6.19.2.tar.bz2':

                 23323 skb:kfree_skb
                     0 skb:consume_skb
                 49897 skb:skb_copy_datagram_iovec
                  6217 net:net_dev_xmit
                  6217 net:net_dev_queue
                  7962 net:netif_receive_skb
                     2 net:netif_rx
                  8340 napi:napi_poll
                     0 sched:sched_kthread_stop
                     0 sched:sched_kthread_stop_ret
                  3749 sched:sched_wakeup
                     0 sched:sched_wakeup_new
                     0 sched:sched_switch
                    29 sched:sched_migrate_task
                     0 sched:sched_process_free
                     1 sched:sched_process_exit
                     0 sched:sched_wait_task
                     0 sched:sched_process_wait
                     0 sched:sched_process_fork
                     1 sched:sched_process_exec
                     0 sched:sched_stat_wait
         2106519415641 sched:sched_stat_sleep
                     0 sched:sched_stat_iowait
             147453613 sched:sched_stat_blocked
           12903026955 sched:sched_stat_runtime
                     0 sched:sched_pi_setprio
                  3574 workqueue:workqueue_queue_work
                  3574 workqueue:workqueue_activate_work
                     0 workqueue:workqueue_execute_start
                     0 workqueue:workqueue_execute_end
                 16631 irq:irq_handler_entry
                 16631 irq:irq_handler_exit
                 28521 irq:softirq_entry
                 28521 irq:softirq_exit
                 28728 irq:softirq_raise
                     1 syscalls:sys_enter_sendmmsg
                     1 syscalls:sys_exit_sendmmsg
                     0 syscalls:sys_enter_recvmmsg
                     0 syscalls:sys_exit_recvmmsg
                    14 syscalls:sys_enter_socketcall
                    14 syscalls:sys_exit_socketcall
                       .
                       .
                       .
                 16965 syscalls:sys_enter_read
                 16965 syscalls:sys_exit_read
                 12854 syscalls:sys_enter_write
                 12854 syscalls:sys_exit_write
                       .
                       .
                       .

          58.029710972 seconds time elapsed
Let's pick one of these tracepoints and tell perf to do a profile using it as the sampling event:
root@crownbay:~# perf record -g -e sched:sched_wakeup wget http://downloads.yoctoproject.org/mirror/sources/linux-2.6.19.2.tar.bz2
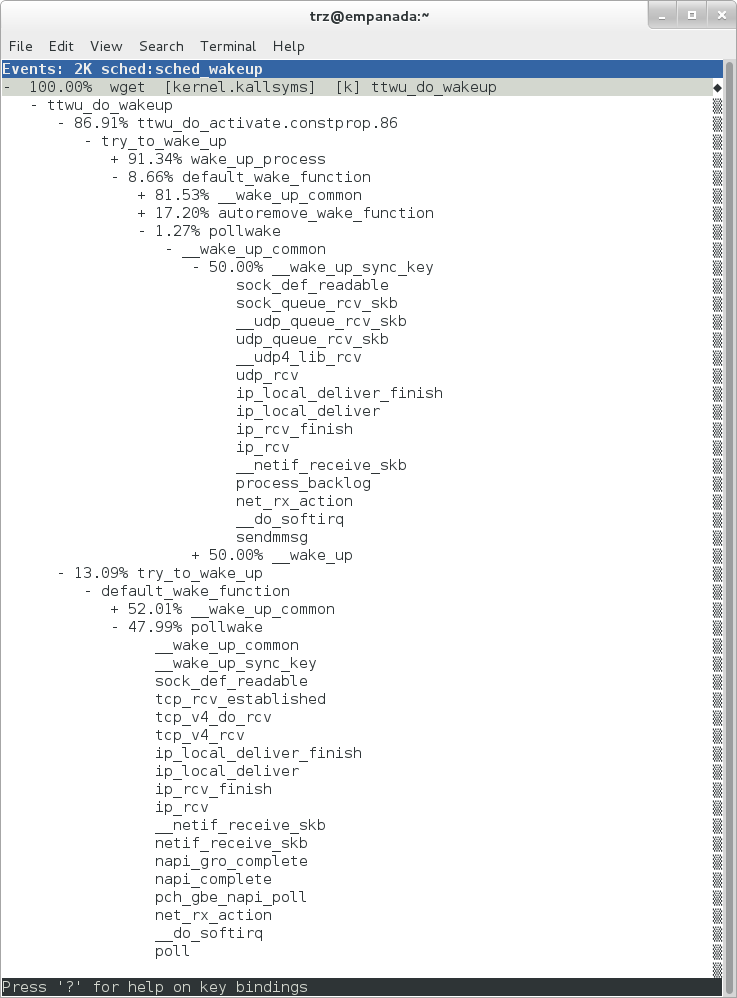 |
The screenshot above shows the results of running a profile using sched:sched_switch tracepoint, which shows the relative costs of various paths to sched_wakeup (note that sched_wakeup is the name of the tracepoint - it's actually defined just inside ttwu_do_wakeup(), which accounts for the function name actually displayed in the profile:
     /*
      * Mark the task runnable and perform wakeup-preemption.
      */
     static void
     ttwu_do_wakeup(struct rq *rq, struct task_struct *p, int wake_flags)
     {
          trace_sched_wakeup(p, true);
          .
          .
          .
     }
A couple of the more interesting callchains are expanded and displayed above, basically some network receive paths that presumably end up waking up wget (busybox) when network data is ready.
Note that because tracepoints are normally used for tracing, the default sampling period for tracepoints is 1 i.e. for tracepoints perf will sample on every event occurrence (this can be changed using the -c option). This is in contrast to hardware counters such as for example the default 'cycles' hardware counter used for normal profiling, where sampling periods are much higher (in the thousands) because profiling should have as low an overhead as possible and sampling on every cycle would be prohibitively expensive.
Profiling is a great tool for solving many problems or for getting a high-level view of what's going on with a workload or across the system. It is however by definition an approximation, as suggested by the most prominent word associated with it, 'sampling'. On the one hand, it allows a representative picture of what's going on in the system to be cheaply taken, but on the other hand, that cheapness limits its utility when that data suggests a need to 'dive down' more deeply to discover what's really going on. In such cases, the only way to see what's really going on is to be able to look at (or summarize more intelligently) the individual steps that go into the higher-level behavior exposed by the coarse-grained profiling data.
As a concrete example, we can trace all the events we think might be applicable to our workload:
     root@crownbay:~# perf record -g -e skb:* -e net:* -e napi:* -e sched:sched_switch -e sched:sched_wakeup -e irq:*
      -e syscalls:sys_enter_read -e syscalls:sys_exit_read -e syscalls:sys_enter_write -e syscalls:sys_exit_write
      wget http://downloads.yoctoproject.org/mirror/sources/linux-2.6.19.2.tar.bz2
We can look at the raw trace output using 'perf script' with no arguments:
     root@crownbay:~# perf script

           perf  1262 [000] 11624.857082: sys_exit_read: 0x0
           perf  1262 [000] 11624.857193: sched_wakeup: comm=migration/0 pid=6 prio=0 success=1 target_cpu=000
           wget  1262 [001] 11624.858021: softirq_raise: vec=1 [action=TIMER]
           wget  1262 [001] 11624.858074: softirq_entry: vec=1 [action=TIMER]
           wget  1262 [001] 11624.858081: softirq_exit: vec=1 [action=TIMER]
           wget  1262 [001] 11624.858166: sys_enter_read: fd: 0x0003, buf: 0xbf82c940, count: 0x0200
           wget  1262 [001] 11624.858177: sys_exit_read: 0x200
           wget  1262 [001] 11624.858878: kfree_skb: skbaddr=0xeb248d80 protocol=0 location=0xc15a5308
           wget  1262 [001] 11624.858945: kfree_skb: skbaddr=0xeb248000 protocol=0 location=0xc15a5308
           wget  1262 [001] 11624.859020: softirq_raise: vec=1 [action=TIMER]
           wget  1262 [001] 11624.859076: softirq_entry: vec=1 [action=TIMER]
           wget  1262 [001] 11624.859083: softirq_exit: vec=1 [action=TIMER]
           wget  1262 [001] 11624.859167: sys_enter_read: fd: 0x0003, buf: 0xb7720000, count: 0x0400
           wget  1262 [001] 11624.859192: sys_exit_read: 0x1d7
           wget  1262 [001] 11624.859228: sys_enter_read: fd: 0x0003, buf: 0xb7720000, count: 0x0400
           wget  1262 [001] 11624.859233: sys_exit_read: 0x0
           wget  1262 [001] 11624.859573: sys_enter_read: fd: 0x0003, buf: 0xbf82c580, count: 0x0200
           wget  1262 [001] 11624.859584: sys_exit_read: 0x200
           wget  1262 [001] 11624.859864: sys_enter_read: fd: 0x0003, buf: 0xb7720000, count: 0x0400
           wget  1262 [001] 11624.859888: sys_exit_read: 0x400
           wget  1262 [001] 11624.859935: sys_enter_read: fd: 0x0003, buf: 0xb7720000, count: 0x0400
           wget  1262 [001] 11624.859944: sys_exit_read: 0x400
This gives us a detailed timestamped sequence of events that occurred within the workload with respect to those events.
In many ways, profiling can be viewed as a subset of tracing - theoretically, if you have a set of trace events that's sufficient to capture all the important aspects of a workload, you can derive any of the results or views that a profiling run can.
Another aspect of traditional profiling is that while powerful in many ways, it's limited by the granularity of the underlying data. Profiling tools offer various ways of sorting and presenting the sample data, which make it much more useful and amenable to user experimentation, but in the end it can't be used in an open-ended way to extract data that just isn't present as a consequence of the fact that conceptually, most of it has been thrown away.
Full-blown detailed tracing data does however offer the opportunity to manipulate and present the information collected during a tracing run in an infinite variety of ways.
Another way to look at it is that there are only so many ways that the 'primitive' counters can be used on their own to generate interesting output; to get anything more complicated than simple counts requires some amount of additional logic, which is typically very specific to the problem at hand. For example, if we wanted to make use of a 'counter' that maps to the value of the time difference between when a process was scheduled to run on a processor and the time it actually ran, we wouldn't expect such a counter to exist on its own, but we could derive one called say 'wakeup_latency' and use it to extract a useful view of that metric from trace data. Likewise, we really can't figure out from standard profiling tools how much data every process on the system reads and writes, along with how many of those reads and writes fail completely. If we have sufficient trace data, however, we could with the right tools easily extract and present that information, but we'd need something other than pre-canned profiling tools to do that.
Luckily, there is a general-purpose way to handle such needs, called 'programming languages'. Making programming languages easily available to apply to such problems given the specific format of data is called a 'programming language binding' for that data and language. Perf supports two programming language bindings, one for Python and one for Perl.
Now that we have the trace data in perf.data, we can use 'perf script -g' to generate a skeleton script with handlers for the read/write entry/exit events we recorded:
     root@crownbay:~# perf script -g python
     generated Python script: perf-script.py
The skeleton script simply creates a python function for each event type in the perf.data file. The body of each function simply prints the event name along with its parameters. For example:
     def net__netif_rx(event_name, context, common_cpu,
            common_secs, common_nsecs, common_pid, common_comm,
            skbaddr, len, name):
                    print_header(event_name, common_cpu, common_secs, common_nsecs,
                            common_pid, common_comm)

		     print "skbaddr=%u, len=%u, name=%s\n" % (skbaddr, len, name),
We can run that script directly to print all of the events contained in the perf.data file:
     root@crownbay:~# perf script -s perf-script.py

     in trace_begin
     syscalls__sys_exit_read     0 11624.857082795     1262 perf                  nr=3, ret=0
     sched__sched_wakeup      0 11624.857193498     1262 perf                  comm=migration/0, pid=6, prio=0,      success=1, target_cpu=0
     irq__softirq_raise       1 11624.858021635     1262 wget                  vec=TIMER
     irq__softirq_entry       1 11624.858074075     1262 wget                  vec=TIMER
     irq__softirq_exit        1 11624.858081389     1262 wget                  vec=TIMER
     syscalls__sys_enter_read     1 11624.858166434     1262 wget                  nr=3, fd=3, buf=3213019456,      count=512
     syscalls__sys_exit_read     1 11624.858177924     1262 wget                  nr=3, ret=512
     skb__kfree_skb           1 11624.858878188     1262 wget                  skbaddr=3945041280,           location=3243922184, protocol=0
     skb__kfree_skb           1 11624.858945608     1262 wget                  skbaddr=3945037824,      location=3243922184, protocol=0
     irq__softirq_raise       1 11624.859020942     1262 wget                  vec=TIMER
     irq__softirq_entry       1 11624.859076935     1262 wget                  vec=TIMER
     irq__softirq_exit        1 11624.859083469     1262 wget                  vec=TIMER
     syscalls__sys_enter_read     1 11624.859167565     1262 wget                  nr=3, fd=3, buf=3077701632,      count=1024
     syscalls__sys_exit_read     1 11624.859192533     1262 wget                  nr=3, ret=471
     syscalls__sys_enter_read     1 11624.859228072     1262 wget                  nr=3, fd=3, buf=3077701632,      count=1024
     syscalls__sys_exit_read     1 11624.859233707     1262 wget                  nr=3, ret=0
     syscalls__sys_enter_read     1 11624.859573008     1262 wget                  nr=3, fd=3, buf=3213018496,      count=512
     syscalls__sys_exit_read     1 11624.859584818     1262 wget                  nr=3, ret=512
     syscalls__sys_enter_read     1 11624.859864562     1262 wget                  nr=3, fd=3, buf=3077701632,      count=1024
     syscalls__sys_exit_read     1 11624.859888770     1262 wget                  nr=3, ret=1024
     syscalls__sys_enter_read     1 11624.859935140     1262 wget                  nr=3, fd=3, buf=3077701632,      count=1024
     syscalls__sys_exit_read     1 11624.859944032     1262 wget                  nr=3, ret=1024
That in itself isn't very useful; after all, we can accomplish pretty much the same thing by simply running 'perf script' without arguments in the same directory as the perf.data file.
We can however replace the print statements in the generated function bodies with whatever we want, and thereby make it infinitely more useful.
As a simple example, let's just replace the print statements in the function bodies with a simple function that does nothing but increment a per-event count. When the program is run against a perf.data file, each time a particular event is encountered, a tally is incremented for that event. For example:
     def net__netif_rx(event_name, context, common_cpu,
            common_secs, common_nsecs, common_pid, common_comm,
            skbaddr, len, name):
		          inc_counts(event_name)
Each event handler function in the generated code is modified to do this. For convenience, we define a common function called inc_counts() that each handler calls; inc_counts() simply tallies a count for each event using the 'counts' hash, which is a specialized hash function that does Perl-like autovivification, a capability that's extremely useful for kinds of multi-level aggregation commonly used in processing traces (see perf's documentation on the Python language binding for details):
     counts = autodict()

     def inc_counts(event_name):
            try:
                    counts[event_name] += 1
            except TypeError:
                    counts[event_name] = 1
Finally, at the end of the trace processing run, we want to print the result of all the per-event tallies. For that, we use the special 'trace_end()' function:
     def trace_end():
            for event_name, count in counts.iteritems():
                    print "%-40s %10s\n" % (event_name, count)
The end result is a summary of all the events recorded in the trace:
     skb__skb_copy_datagram_iovec                  13148
     irq__softirq_entry                             4796
     irq__irq_handler_exit                          3805
     irq__softirq_exit                              4795
     syscalls__sys_enter_write                      8990
     net__net_dev_xmit                               652
     skb__kfree_skb                                 4047
     sched__sched_wakeup                            1155
     irq__irq_handler_entry                         3804
     irq__softirq_raise                             4799
     net__net_dev_queue                              652
     syscalls__sys_enter_read                      17599
     net__netif_receive_skb                         1743
     syscalls__sys_exit_read                       17598
     net__netif_rx                                     2
     napi__napi_poll                                1877
     syscalls__sys_exit_write                       8990
Note that this is pretty much exactly the same information we get from 'perf stat', which goes a little way to support the idea mentioned previously that given the right kind of trace data, higher-level profiling-type summaries can be derived from it.
Documentation on using the 'perf script' python binding.
The examples so far have focused on tracing a particular program or workload - in other words, every profiling run has specified the program to profile in the command-line e.g. 'perf record wget ...'.
It's also possible, and more interesting in many cases, to run a system-wide profile or trace while running the workload in a separate shell.
To do system-wide profiling or tracing, you typically use the -a flag to 'perf record'.
To demonstrate this, open up one window and start the profile using the -a flag (press Ctrl-C to stop tracing):
     root@crownbay:~# perf record -g -a
     ^C[ perf record: Woken up 6 times to write data ]
     [ perf record: Captured and wrote 1.400 MB perf.data (~61172 samples) ]
In another window, run the wget test:
     root@crownbay:~# wget http://downloads.yoctoproject.org/mirror/sources/linux-2.6.19.2.tar.bz2
     Connecting to downloads.yoctoproject.org (140.211.169.59:80)
     linux-2.6.19.2.tar.b 100% |*******************************| 41727k  0:00:00 ETA
Here we see entries not only for our wget load, but for other processes running on the system as well:
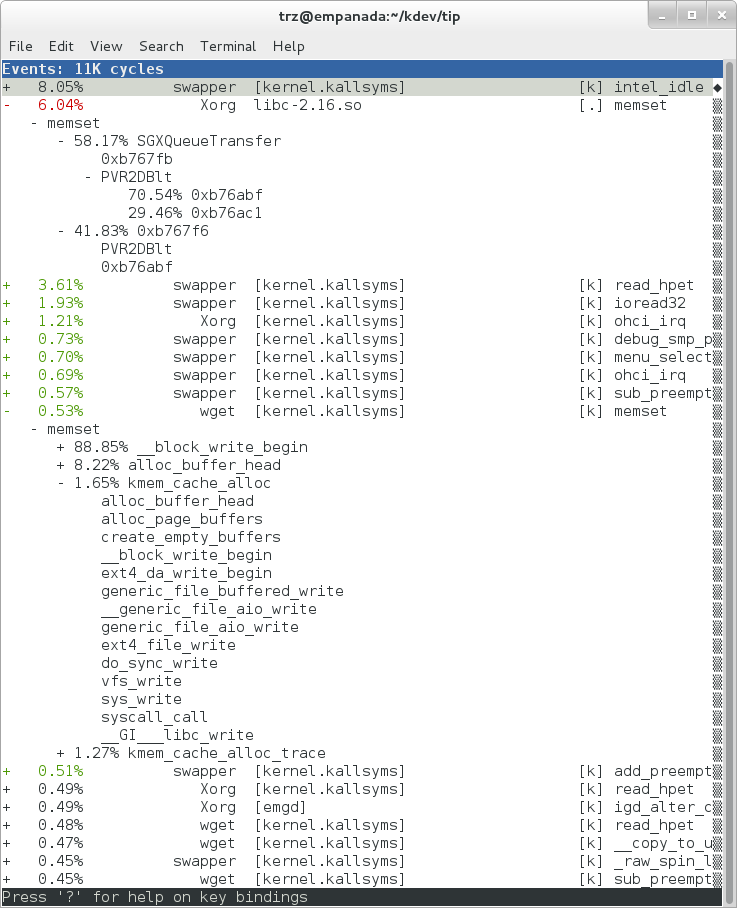 |
In the snapshot above, we can see callchains that originate in libc, and a callchain from Xorg that demonstrates that we're using a proprietary X driver in userspace (notice the presence of 'PVR' and some other unresolvable symbols in the expanded Xorg callchain).
Note also that we have both kernel and userspace entries in the above snapshot. We can also tell perf to focus on userspace but providing a modifier, in this case 'u', to the 'cycles' hardware counter when we record a profile:
     root@crownbay:~# perf record -g -a -e cycles:u
     ^C[ perf record: Woken up 2 times to write data ]
     [ perf record: Captured and wrote 0.376 MB perf.data (~16443 samples) ]
 |
Notice in the screenshot above, we see only userspace entries ([.])
Finally, we can press 'enter' on a leaf node and select the 'Zoom into DSO' menu item to show only entries associated with a specific DSO. In the screenshot below, we've zoomed into the 'libc' DSO which shows all the entries associated with the libc-xxx.so DSO.
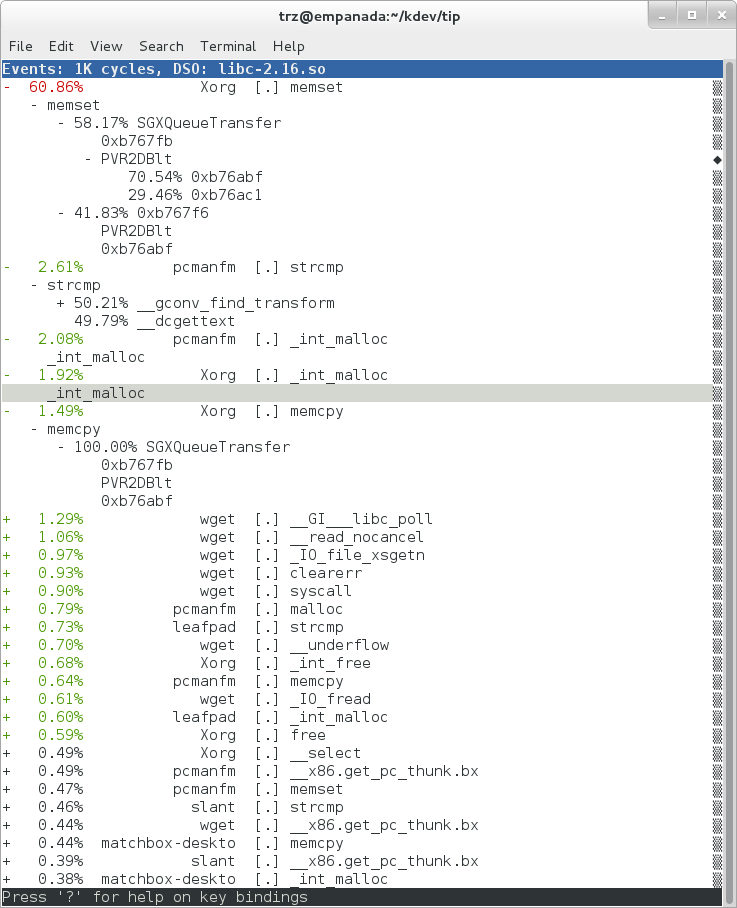 |
We can also use the system-wide -a switch to do system-wide tracing. Here we'll trace a couple of scheduler events:
     root@crownbay:~# perf record -a -e sched:sched_switch -e sched:sched_wakeup
     ^C[ perf record: Woken up 38 times to write data ]
     [ perf record: Captured and wrote 9.780 MB perf.data (~427299 samples) ]
We can look at the raw output using 'perf script' with no arguments:
     root@crownbay:~# perf script

                perf  1383 [001]  6171.460045: sched_wakeup: comm=kworker/1:1 pid=21 prio=120 success=1 target_cpu=001
                perf  1383 [001]  6171.460066: sched_switch: prev_comm=perf prev_pid=1383 prev_prio=120 prev_state=R+ ==> next_comm=kworker/1:1 next_pid=21 next_prio=120
         kworker/1:1    21 [001]  6171.460093: sched_switch: prev_comm=kworker/1:1 prev_pid=21 prev_prio=120 prev_state=S ==> next_comm=perf next_pid=1383 next_prio=120
             swapper     0 [000]  6171.468063: sched_wakeup: comm=kworker/0:3 pid=1209 prio=120 success=1 target_cpu=000
             swapper     0 [000]  6171.468107: sched_switch: prev_comm=swapper/0 prev_pid=0 prev_prio=120 prev_state=R ==> next_comm=kworker/0:3 next_pid=1209 next_prio=120
         kworker/0:3  1209 [000]  6171.468143: sched_switch: prev_comm=kworker/0:3 prev_pid=1209 prev_prio=120 prev_state=S ==> next_comm=swapper/0 next_pid=0 next_prio=120
                perf  1383 [001]  6171.470039: sched_wakeup: comm=kworker/1:1 pid=21 prio=120 success=1 target_cpu=001
                perf  1383 [001]  6171.470058: sched_switch: prev_comm=perf prev_pid=1383 prev_prio=120 prev_state=R+ ==> next_comm=kworker/1:1 next_pid=21 next_prio=120
         kworker/1:1    21 [001]  6171.470082: sched_switch: prev_comm=kworker/1:1 prev_pid=21 prev_prio=120 prev_state=S ==> next_comm=perf next_pid=1383 next_prio=120
                perf  1383 [001]  6171.480035: sched_wakeup: comm=kworker/1:1 pid=21 prio=120 success=1 target_cpu=001
Notice that there are a lot of events that don't really have anything to do with what we're interested in, namely events that schedule 'perf' itself in and out or that wake perf up. We can get rid of those by using the '--filter' option - for each event we specify using -e, we can add a --filter after that to filter out trace events that contain fields with specific values:
     root@crownbay:~# perf record -a -e sched:sched_switch --filter 'next_comm != perf && prev_comm != perf' -e sched:sched_wakeup --filter 'comm != perf'
     ^C[ perf record: Woken up 38 times to write data ]
     [ perf record: Captured and wrote 9.688 MB perf.data (~423279 samples) ]


     root@crownbay:~# perf script

             swapper     0 [000]  7932.162180: sched_switch: prev_comm=swapper/0 prev_pid=0 prev_prio=120 prev_state=R ==> next_comm=kworker/0:3 next_pid=1209 next_prio=120
         kworker/0:3  1209 [000]  7932.162236: sched_switch: prev_comm=kworker/0:3 prev_pid=1209 prev_prio=120 prev_state=S ==> next_comm=swapper/0 next_pid=0 next_prio=120
                perf  1407 [001]  7932.170048: sched_wakeup: comm=kworker/1:1 pid=21 prio=120 success=1 target_cpu=001
                perf  1407 [001]  7932.180044: sched_wakeup: comm=kworker/1:1 pid=21 prio=120 success=1 target_cpu=001
                perf  1407 [001]  7932.190038: sched_wakeup: comm=kworker/1:1 pid=21 prio=120 success=1 target_cpu=001
                perf  1407 [001]  7932.200044: sched_wakeup: comm=kworker/1:1 pid=21 prio=120 success=1 target_cpu=001
                perf  1407 [001]  7932.210044: sched_wakeup: comm=kworker/1:1 pid=21 prio=120 success=1 target_cpu=001
                perf  1407 [001]  7932.220044: sched_wakeup: comm=kworker/1:1 pid=21 prio=120 success=1 target_cpu=001
             swapper     0 [001]  7932.230111: sched_wakeup: comm=kworker/1:1 pid=21 prio=120 success=1 target_cpu=001
             swapper     0 [001]  7932.230146: sched_switch: prev_comm=swapper/1 prev_pid=0 prev_prio=120 prev_state=R ==> next_comm=kworker/1:1 next_pid=21 next_prio=120
         kworker/1:1    21 [001]  7932.230205: sched_switch: prev_comm=kworker/1:1 prev_pid=21 prev_prio=120 prev_state=S ==> next_comm=swapper/1 next_pid=0 next_prio=120
             swapper     0 [000]  7932.326109: sched_wakeup: comm=kworker/0:3 pid=1209 prio=120 success=1 target_cpu=000
             swapper     0 [000]  7932.326171: sched_switch: prev_comm=swapper/0 prev_pid=0 prev_prio=120 prev_state=R ==> next_comm=kworker/0:3 next_pid=1209 next_prio=120
         kworker/0:3  1209 [000]  7932.326214: sched_switch: prev_comm=kworker/0:3 prev_pid=1209 prev_prio=120 prev_state=S ==> next_comm=swapper/0 next_pid=0 next_prio=120
In this case, we've filtered out all events that have 'perf' in their 'comm' or 'comm_prev' or 'comm_next' fields. Notice that there are still events recorded for perf, but notice that those events don't have values of 'perf' for the filtered fields. To completely filter out anything from perf will require a bit more work, but for the purpose of demonstrating how to use filters, it's close enough.
perf isn't restricted to the fixed set of static tracepoints listed by 'perf list'. Users can also add their own 'dynamic' tracepoints anywhere in the kernel. For instance, suppose we want to define our own tracepoint on do_fork(). We can do that using the 'perf probe' perf subcommand:
     root@crownbay:~# perf probe do_fork
     Added new event:
       probe:do_fork        (on do_fork)

     You can now use it in all perf tools, such as:

	     perf record -e probe:do_fork -aR sleep 1
Adding a new tracepoint via 'perf probe' results in an event with all the expected files and format in /sys/kernel/debug/tracing/events, just the same as for static tracepoints (as discussed in more detail in the trace events subsystem section:
     root@crownbay:/sys/kernel/debug/tracing/events/probe/do_fork# ls -al
     drwxr-xr-x    2 root     root             0 Oct 28 11:42 .
     drwxr-xr-x    3 root     root             0 Oct 28 11:42 ..
     -rw-r--r--    1 root     root             0 Oct 28 11:42 enable
     -rw-r--r--    1 root     root             0 Oct 28 11:42 filter
     -r--r--r--    1 root     root             0 Oct 28 11:42 format
     -r--r--r--    1 root     root             0 Oct 28 11:42 id

     root@crownbay:/sys/kernel/debug/tracing/events/probe/do_fork# cat format
     name: do_fork
     ID: 944
     format:
	     field:unsigned short common_type;	offset:0;	size:2;	signed:0;
	     field:unsigned char common_flags;	offset:2;	size:1;	signed:0;
	     field:unsigned char common_preempt_count;	offset:3;	size:1;	signed:0;
	     field:int common_pid;	offset:4;	size:4;	signed:1;
	     field:int common_padding;	offset:8;	size:4;	signed:1;

	     field:unsigned long __probe_ip;	offset:12;	size:4;	signed:0;

     print fmt: "(%lx)", REC->__probe_ip
We can list all dynamic tracepoints currently in existence:
     root@crownbay:~# perf probe -l
      probe:do_fork        (on do_fork)
      probe:schedule       (on schedule)
Let's record system-wide ('sleep 30' is a trick for recording system-wide but basically do nothing and then wake up after 30 seconds):
     root@crownbay:~# perf record -g -a -e probe:do_fork sleep 30
     [ perf record: Woken up 1 times to write data ]
     [ perf record: Captured and wrote 0.087 MB perf.data (~3812 samples) ]
Using 'perf script' we can see each do_fork event that fired:
     root@crownbay:~# perf script

     # ========
     # captured on: Sun Oct 28 11:55:18 2012
     # hostname : crownbay
     # os release : 3.4.11-yocto-standard
     # perf version : 3.4.11
     # arch : i686
     # nrcpus online : 2
     # nrcpus avail : 2
     # cpudesc : Intel(R) Atom(TM) CPU E660 @ 1.30GHz
     # cpuid : GenuineIntel,6,38,1
     # total memory : 1017184 kB
     # cmdline : /usr/bin/perf record -g -a -e probe:do_fork sleep 30
     # event : name = probe:do_fork, type = 2, config = 0x3b0, config1 = 0x0, config2 = 0x0, excl_usr = 0, excl_kern
      = 0, id = { 5, 6 }
     # HEADER_CPU_TOPOLOGY info available, use -I to display
     # ========
     #
      matchbox-deskto  1197 [001] 34211.378318: do_fork: (c1028460)
      matchbox-deskto  1295 [001] 34211.380388: do_fork: (c1028460)
              pcmanfm  1296 [000] 34211.632350: do_fork: (c1028460)
              pcmanfm  1296 [000] 34211.639917: do_fork: (c1028460)
      matchbox-deskto  1197 [001] 34217.541603: do_fork: (c1028460)
      matchbox-deskto  1299 [001] 34217.543584: do_fork: (c1028460)
               gthumb  1300 [001] 34217.697451: do_fork: (c1028460)
               gthumb  1300 [001] 34219.085734: do_fork: (c1028460)
               gthumb  1300 [000] 34219.121351: do_fork: (c1028460)
               gthumb  1300 [001] 34219.264551: do_fork: (c1028460)
              pcmanfm  1296 [000] 34219.590380: do_fork: (c1028460)
      matchbox-deskto  1197 [001] 34224.955965: do_fork: (c1028460)
      matchbox-deskto  1306 [001] 34224.957972: do_fork: (c1028460)
      matchbox-termin  1307 [000] 34225.038214: do_fork: (c1028460)
      matchbox-termin  1307 [001] 34225.044218: do_fork: (c1028460)
      matchbox-termin  1307 [000] 34225.046442: do_fork: (c1028460)
      matchbox-deskto  1197 [001] 34237.112138: do_fork: (c1028460)
      matchbox-deskto  1311 [001] 34237.114106: do_fork: (c1028460)
                 gaku  1312 [000] 34237.202388: do_fork: (c1028460)
And using 'perf report' on the same file, we can see the callgraphs from starting a few programs during those 30 seconds:
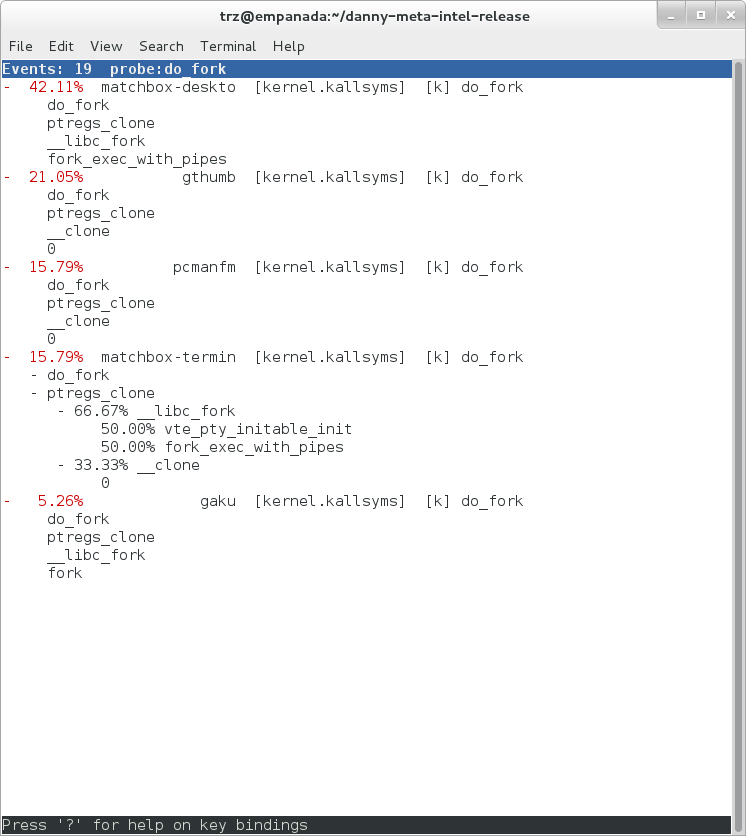 |
Online versions of the man pages for the commands discussed in this section can be found here:
The 'perf stat' manpage.
The 'perf probe' manpage.
Documentation on using the 'perf script' python binding.
The top-level perf(1) manpage.
Normally, you should be able to invoke the man pages via perf itself e.g. 'perf help' or 'perf help record'.
However, by default Yocto doesn't install man pages, but perf invokes the man pages for most help functionality. This is a bug and is being addressed by a Yocto bug: Bug 3388 - perf: enable man pages for basic 'help' functionality.
The man pages in text form, along with some other files, such as a set of examples, can be found in the 'perf' directory of the kernel tree:
tools/perf/Documentation
There's also a nice perf tutorial on the perf wiki that goes into more detail than we do here in certain areas: Perf Tutorial
'ftrace' literally refers to the 'ftrace function tracer' but in reality this encompasses a number of related tracers along with the infrastructure that they all make use of.
For this section, we'll assume you've already performed the basic setup outlined in the General Setup section.
ftrace, trace-cmd, and kernelshark run on the target system, and are ready to go out-of-the-box - no additional setup is necessary. For the rest of this section we assume you've ssh'ed to the host and will be running ftrace on the target. kernelshark is a GUI application and if you use the '-X' option to ssh you can have the kernelshark GUI run on the target but display remotely on the host if you want.
'ftrace' essentially refers to everything included in the /tracing directory of the mounted debugfs filesystem (Yocto follows the standard convention and mounts it at /sys/kernel/debug). Here's a listing of all the files found in /sys/kernel/debug/tracing on a Yocto system:
     root@sugarbay:/sys/kernel/debug/tracing# ls
     README                      kprobe_events               trace
     available_events            kprobe_profile              trace_clock
     available_filter_functions  options                     trace_marker
     available_tracers           per_cpu                     trace_options
     buffer_size_kb              printk_formats              trace_pipe
     buffer_total_size_kb        saved_cmdlines              tracing_cpumask
     current_tracer              set_event                   tracing_enabled
     dyn_ftrace_total_info       set_ftrace_filter           tracing_on
     enabled_functions           set_ftrace_notrace          tracing_thresh
     events                      set_ftrace_pid
     free_buffer                 set_graph_function
The files listed above are used for various purposes - some relate directly to the tracers themselves, others are used to set tracing options, and yet others actually contain the tracing output when a tracer is in effect. Some of the functions can be guessed from their names, others need explanation; in any case, we'll cover some of the files we see here below but for an explanation of the others, please see the ftrace documentation.
We'll start by looking at some of the available built-in tracers.
cat'ing the 'available_tracers' file lists the set of available tracers:
     root@sugarbay:/sys/kernel/debug/tracing# cat available_tracers
     blk function_graph function nop
The 'current_tracer' file contains the tracer currently in effect:
     root@sugarbay:/sys/kernel/debug/tracing# cat current_tracer
     nop
The above listing of current_tracer shows that the 'nop' tracer is in effect, which is just another way of saying that there's actually no tracer currently in effect.
echo'ing one of the available_tracers into current_tracer makes the specified tracer the current tracer:
     root@sugarbay:/sys/kernel/debug/tracing# echo function > current_tracer
     root@sugarbay:/sys/kernel/debug/tracing# cat current_tracer
     function
The above sets the current tracer to be the 'function tracer'. This tracer traces every function call in the kernel and makes it available as the contents of the 'trace' file. Reading the 'trace' file lists the currently buffered function calls that have been traced by the function tracer:
     root@sugarbay:/sys/kernel/debug/tracing# cat trace | less

     # tracer: function
     #
     # entries-in-buffer/entries-written: 310629/766471   #P:8
     #
     #                              _-----=> irqs-off
     #                             / _----=> need-resched
     #                            | / _---=> hardirq/softirq
     #                            || / _--=> preempt-depth
     #                            ||| /     delay
     #           TASK-PID   CPU#  ||||    TIMESTAMP  FUNCTION
     #              | |       |   ||||       |         |
              <idle>-0     [004] d..1   470.867169: ktime_get_real <-intel_idle
              <idle>-0     [004] d..1   470.867170: getnstimeofday <-ktime_get_real
              <idle>-0     [004] d..1   470.867171: ns_to_timeval <-intel_idle
              <idle>-0     [004] d..1   470.867171: ns_to_timespec <-ns_to_timeval
              <idle>-0     [004] d..1   470.867172: smp_apic_timer_interrupt <-apic_timer_interrupt
              <idle>-0     [004] d..1   470.867172: native_apic_mem_write <-smp_apic_timer_interrupt
              <idle>-0     [004] d..1   470.867172: irq_enter <-smp_apic_timer_interrupt
              <idle>-0     [004] d..1   470.867172: rcu_irq_enter <-irq_enter
              <idle>-0     [004] d..1   470.867173: rcu_idle_exit_common.isra.33 <-rcu_irq_enter
              <idle>-0     [004] d..1   470.867173: local_bh_disable <-irq_enter
              <idle>-0     [004] d..1   470.867173: add_preempt_count <-local_bh_disable
              <idle>-0     [004] d.s1   470.867174: tick_check_idle <-irq_enter
              <idle>-0     [004] d.s1   470.867174: tick_check_oneshot_broadcast <-tick_check_idle
              <idle>-0     [004] d.s1   470.867174: ktime_get <-tick_check_idle
              <idle>-0     [004] d.s1   470.867174: tick_nohz_stop_idle <-tick_check_idle
              <idle>-0     [004] d.s1   470.867175: update_ts_time_stats <-tick_nohz_stop_idle
              <idle>-0     [004] d.s1   470.867175: nr_iowait_cpu <-update_ts_time_stats
              <idle>-0     [004] d.s1   470.867175: tick_do_update_jiffies64 <-tick_check_idle
              <idle>-0     [004] d.s1   470.867175: _raw_spin_lock <-tick_do_update_jiffies64
              <idle>-0     [004] d.s1   470.867176: add_preempt_count <-_raw_spin_lock
              <idle>-0     [004] d.s2   470.867176: do_timer <-tick_do_update_jiffies64
              <idle>-0     [004] d.s2   470.867176: _raw_spin_lock <-do_timer
              <idle>-0     [004] d.s2   470.867176: add_preempt_count <-_raw_spin_lock
              <idle>-0     [004] d.s3   470.867177: ntp_tick_length <-do_timer
              <idle>-0     [004] d.s3   470.867177: _raw_spin_lock_irqsave <-ntp_tick_length
              .
              .
              .
Each line in the trace above shows what was happening in the kernel on a given cpu, to the level of detail of function calls. Each entry shows the function called, followed by its caller (after the arrow).
The function tracer gives you an extremely detailed idea of what the kernel was doing at the point in time the trace was taken, and is a great way to learn about how the kernel code works in a dynamic sense.
It is a little more difficult to follow the call chains than it needs to be - luckily there's a variant of the function tracer that displays the callchains explicitly, called the 'function_graph' tracer:
     root@sugarbay:/sys/kernel/debug/tracing# echo function_graph > current_tracer
     root@sugarbay:/sys/kernel/debug/tracing# cat trace | less

      tracer: function_graph

      CPU  DURATION                  FUNCTION CALLS
      |     |   |                     |   |   |   |
     7)   0.046 us    |      pick_next_task_fair();
     7)   0.043 us    |      pick_next_task_stop();
     7)   0.042 us    |      pick_next_task_rt();
     7)   0.032 us    |      pick_next_task_fair();
     7)   0.030 us    |      pick_next_task_idle();
     7)               |      _raw_spin_unlock_irq() {
     7)   0.033 us    |        sub_preempt_count();
     7)   0.258 us    |      }
     7)   0.032 us    |      sub_preempt_count();
     7) + 13.341 us   |    } /* __schedule */
     7)   0.095 us    |  } /* sub_preempt_count */
     7)               |  schedule() {
     7)               |    __schedule() {
     7)   0.060 us    |      add_preempt_count();
     7)   0.044 us    |      rcu_note_context_switch();
     7)               |      _raw_spin_lock_irq() {
     7)   0.033 us    |        add_preempt_count();
     7)   0.247 us    |      }
     7)               |      idle_balance() {
     7)               |        _raw_spin_unlock() {
     7)   0.031 us    |          sub_preempt_count();
     7)   0.246 us    |        }
     7)               |        update_shares() {
     7)   0.030 us    |          __rcu_read_lock();
     7)   0.029 us    |          __rcu_read_unlock();
     7)   0.484 us    |        }
     7)   0.030 us    |        __rcu_read_lock();
     7)               |        load_balance() {
     7)               |          find_busiest_group() {
     7)   0.031 us    |            idle_cpu();
     7)   0.029 us    |            idle_cpu();
     7)   0.035 us    |            idle_cpu();
     7)   0.906 us    |          }
     7)   1.141 us    |        }
     7)   0.022 us    |        msecs_to_jiffies();
     7)               |        load_balance() {
     7)               |          find_busiest_group() {
     7)   0.031 us    |            idle_cpu();
     .
     .
     .
     4)   0.062 us    |        msecs_to_jiffies();
     4)   0.062 us    |        __rcu_read_unlock();
     4)               |        _raw_spin_lock() {
     4)   0.073 us    |          add_preempt_count();
     4)   0.562 us    |        }
     4) + 17.452 us   |      }
     4)   0.108 us    |      put_prev_task_fair();
     4)   0.102 us    |      pick_next_task_fair();
     4)   0.084 us    |      pick_next_task_stop();
     4)   0.075 us    |      pick_next_task_rt();
     4)   0.062 us    |      pick_next_task_fair();
     4)   0.066 us    |      pick_next_task_idle();
     ------------------------------------------
     4)   kworker-74   =>    <idle>-0
     ------------------------------------------

     4)               |      finish_task_switch() {
     4)               |        _raw_spin_unlock_irq() {
     4)   0.100 us    |          sub_preempt_count();
     4)   0.582 us    |        }
     4)   1.105 us    |      }
     4)   0.088 us    |      sub_preempt_count();
     4) ! 100.066 us  |    }
     .
     .
     .
     3)               |  sys_ioctl() {
     3)   0.083 us    |    fget_light();
     3)               |    security_file_ioctl() {
     3)   0.066 us    |      cap_file_ioctl();
     3)   0.562 us    |    }
     3)               |    do_vfs_ioctl() {
     3)               |      drm_ioctl() {
     3)   0.075 us    |        drm_ut_debug_printk();
     3)               |        i915_gem_pwrite_ioctl() {
     3)               |          i915_mutex_lock_interruptible() {
     3)   0.070 us    |            mutex_lock_interruptible();
     3)   0.570 us    |          }
     3)               |          drm_gem_object_lookup() {
     3)               |            _raw_spin_lock() {
     3)   0.080 us    |              add_preempt_count();
     3)   0.620 us    |            }
     3)               |            _raw_spin_unlock() {
     3)   0.085 us    |              sub_preempt_count();
     3)   0.562 us    |            }
     3)   2.149 us    |          }
     3)   0.133 us    |          i915_gem_object_pin();
     3)               |          i915_gem_object_set_to_gtt_domain() {
     3)   0.065 us    |            i915_gem_object_flush_gpu_write_domain();
     3)   0.065 us    |            i915_gem_object_wait_rendering();
     3)   0.062 us    |            i915_gem_object_flush_cpu_write_domain();
     3)   1.612 us    |          }
     3)               |          i915_gem_object_put_fence() {
     3)   0.097 us    |            i915_gem_object_flush_fence.constprop.36();
     3)   0.645 us    |          }
     3)   0.070 us    |          add_preempt_count();
     3)   0.070 us    |          sub_preempt_count();
     3)   0.073 us    |          i915_gem_object_unpin();
     3)   0.068 us    |          mutex_unlock();
     3)   9.924 us    |        }
     3) + 11.236 us   |      }
     3) + 11.770 us   |    }
     3) + 13.784 us   |  }
     3)               |  sys_ioctl() {
As you can see, the function_graph display is much easier to follow. Also note that in addition to the function calls and associated braces, other events such as scheduler events are displayed in context. In fact, you can freely include any tracepoint available in the trace events subsystem described in the next section by simply enabling those events, and they'll appear in context in the function graph display. Quite a powerful tool for understanding kernel dynamics.
Also notice that there are various annotations on the left hand side of the display. For example if the total time it took for a given function to execute is above a certain threshold, an exclamation point or plus sign appears on the left hand side. Please see the ftrace documentation for details on all these fields.
One especially important directory contained within the /sys/kernel/debug/tracing directory is the 'events' subdirectory, which contains representations of every tracepoint in the system. Listing out the contents of the 'events' subdirectory, we see mainly another set of subdirectories:
     root@sugarbay:/sys/kernel/debug/tracing# cd events
     root@sugarbay:/sys/kernel/debug/tracing/events# ls -al
     drwxr-xr-x   38 root     root             0 Nov 14 23:19 .
     drwxr-xr-x    5 root     root             0 Nov 14 23:19 ..
     drwxr-xr-x   19 root     root             0 Nov 14 23:19 block
     drwxr-xr-x   32 root     root             0 Nov 14 23:19 btrfs
     drwxr-xr-x    5 root     root             0 Nov 14 23:19 drm
     -rw-r--r--    1 root     root             0 Nov 14 23:19 enable
     drwxr-xr-x   40 root     root             0 Nov 14 23:19 ext3
     drwxr-xr-x   79 root     root             0 Nov 14 23:19 ext4
     drwxr-xr-x   14 root     root             0 Nov 14 23:19 ftrace
     drwxr-xr-x    8 root     root             0 Nov 14 23:19 hda
     -r--r--r--    1 root     root             0 Nov 14 23:19 header_event
     -r--r--r--    1 root     root             0 Nov 14 23:19 header_page
     drwxr-xr-x   25 root     root             0 Nov 14 23:19 i915
     drwxr-xr-x    7 root     root             0 Nov 14 23:19 irq
     drwxr-xr-x   12 root     root             0 Nov 14 23:19 jbd
     drwxr-xr-x   14 root     root             0 Nov 14 23:19 jbd2
     drwxr-xr-x   14 root     root             0 Nov 14 23:19 kmem
     drwxr-xr-x    7 root     root             0 Nov 14 23:19 module
     drwxr-xr-x    3 root     root             0 Nov 14 23:19 napi
     drwxr-xr-x    6 root     root             0 Nov 14 23:19 net
     drwxr-xr-x    3 root     root             0 Nov 14 23:19 oom
     drwxr-xr-x   12 root     root             0 Nov 14 23:19 power
     drwxr-xr-x    3 root     root             0 Nov 14 23:19 printk
     drwxr-xr-x    8 root     root             0 Nov 14 23:19 random
     drwxr-xr-x    4 root     root             0 Nov 14 23:19 raw_syscalls
     drwxr-xr-x    3 root     root             0 Nov 14 23:19 rcu
     drwxr-xr-x    6 root     root             0 Nov 14 23:19 rpm
     drwxr-xr-x   20 root     root             0 Nov 14 23:19 sched
     drwxr-xr-x    7 root     root             0 Nov 14 23:19 scsi
     drwxr-xr-x    4 root     root             0 Nov 14 23:19 signal
     drwxr-xr-x    5 root     root             0 Nov 14 23:19 skb
     drwxr-xr-x    4 root     root             0 Nov 14 23:19 sock
     drwxr-xr-x   10 root     root             0 Nov 14 23:19 sunrpc
     drwxr-xr-x  538 root     root             0 Nov 14 23:19 syscalls
     drwxr-xr-x    4 root     root             0 Nov 14 23:19 task
     drwxr-xr-x   14 root     root             0 Nov 14 23:19 timer
     drwxr-xr-x    3 root     root             0 Nov 14 23:19 udp
     drwxr-xr-x   21 root     root             0 Nov 14 23:19 vmscan
     drwxr-xr-x    3 root     root             0 Nov 14 23:19 vsyscall
     drwxr-xr-x    6 root     root             0 Nov 14 23:19 workqueue
     drwxr-xr-x   26 root     root             0 Nov 14 23:19 writeback
Each one of these subdirectories corresponds to a 'subsystem' and contains yet again more subdirectories, each one of those finally corresponding to a tracepoint. For example, here are the contents of the 'kmem' subsystem:
     root@sugarbay:/sys/kernel/debug/tracing/events# cd kmem
     root@sugarbay:/sys/kernel/debug/tracing/events/kmem# ls -al
     drwxr-xr-x   14 root     root             0 Nov 14 23:19 .
     drwxr-xr-x   38 root     root             0 Nov 14 23:19 ..
     -rw-r--r--    1 root     root             0 Nov 14 23:19 enable
     -rw-r--r--    1 root     root             0 Nov 14 23:19 filter
     drwxr-xr-x    2 root     root             0 Nov 14 23:19 kfree
     drwxr-xr-x    2 root     root             0 Nov 14 23:19 kmalloc
     drwxr-xr-x    2 root     root             0 Nov 14 23:19 kmalloc_node
     drwxr-xr-x    2 root     root             0 Nov 14 23:19 kmem_cache_alloc
     drwxr-xr-x    2 root     root             0 Nov 14 23:19 kmem_cache_alloc_node
     drwxr-xr-x    2 root     root             0 Nov 14 23:19 kmem_cache_free
     drwxr-xr-x    2 root     root             0 Nov 14 23:19 mm_page_alloc
     drwxr-xr-x    2 root     root             0 Nov 14 23:19 mm_page_alloc_extfrag
     drwxr-xr-x    2 root     root             0 Nov 14 23:19 mm_page_alloc_zone_locked
     drwxr-xr-x    2 root     root             0 Nov 14 23:19 mm_page_free
     drwxr-xr-x    2 root     root             0 Nov 14 23:19 mm_page_free_batched
     drwxr-xr-x    2 root     root             0 Nov 14 23:19 mm_page_pcpu_drain
Let's see what's inside the subdirectory for a specific tracepoint, in this case the one for kmalloc:
     root@sugarbay:/sys/kernel/debug/tracing/events/kmem# cd kmalloc
     root@sugarbay:/sys/kernel/debug/tracing/events/kmem/kmalloc# ls -al
     drwxr-xr-x    2 root     root             0 Nov 14 23:19 .
     drwxr-xr-x   14 root     root             0 Nov 14 23:19 ..
     -rw-r--r--    1 root     root             0 Nov 14 23:19 enable
     -rw-r--r--    1 root     root             0 Nov 14 23:19 filter
     -r--r--r--    1 root     root             0 Nov 14 23:19 format
     -r--r--r--    1 root     root             0 Nov 14 23:19 id
The 'format' file for the tracepoint describes the event in memory, which is used by the various tracing tools that now make use of these tracepoint to parse the event and make sense of it, along with a 'print fmt' field that allows tools like ftrace to display the event as text. Here's what the format of the kmalloc event looks like:
     root@sugarbay:/sys/kernel/debug/tracing/events/kmem/kmalloc# cat format
     name: kmalloc
     ID: 313
     format:
	     field:unsigned short common_type;	offset:0;	size:2;	signed:0;
	     field:unsigned char common_flags;	offset:2;	size:1;	signed:0;
	     field:unsigned char common_preempt_count;	offset:3;	size:1;	signed:0;
	     field:int common_pid;	offset:4;	size:4;	signed:1;
	     field:int common_padding;	offset:8;	size:4;	signed:1;

	     field:unsigned long call_site;	offset:16;	size:8;	signed:0;
	     field:const void * ptr;	offset:24;	size:8;	signed:0;
	     field:size_t bytes_req;	offset:32;	size:8;	signed:0;
	     field:size_t bytes_alloc;	offset:40;	size:8;	signed:0;
	     field:gfp_t gfp_flags;	offset:48;	size:4;	signed:0;

     print fmt: "call_site=%lx ptr=%p bytes_req=%zu bytes_alloc=%zu gfp_flags=%s", REC->call_site, REC->ptr, REC->bytes_req, REC->bytes_alloc,
     (REC->gfp_flags) ? __print_flags(REC->gfp_flags, "|", {(unsigned long)(((( gfp_t)0x10u) | (( gfp_t)0x40u) | (( gfp_t)0x80u) | ((
     gfp_t)0x20000u) | (( gfp_t)0x02u) | (( gfp_t)0x08u)) | (( gfp_t)0x4000u) | (( gfp_t)0x10000u) | (( gfp_t)0x1000u) | (( gfp_t)0x200u) | ((
     gfp_t)0x400000u)), "GFP_TRANSHUGE"}, {(unsigned long)((( gfp_t)0x10u) | (( gfp_t)0x40u) | (( gfp_t)0x80u) | (( gfp_t)0x20000u) | ((
     gfp_t)0x02u) | (( gfp_t)0x08u)), "GFP_HIGHUSER_MOVABLE"}, {(unsigned long)((( gfp_t)0x10u) | (( gfp_t)0x40u) | (( gfp_t)0x80u) | ((
     gfp_t)0x20000u) | (( gfp_t)0x02u)), "GFP_HIGHUSER"}, {(unsigned long)((( gfp_t)0x10u) | (( gfp_t)0x40u) | (( gfp_t)0x80u) | ((
     gfp_t)0x20000u)), "GFP_USER"}, {(unsigned long)((( gfp_t)0x10u) | (( gfp_t)0x40u) | (( gfp_t)0x80u) | (( gfp_t)0x80000u)), GFP_TEMPORARY"},
     {(unsigned long)((( gfp_t)0x10u) | (( gfp_t)0x40u) | (( gfp_t)0x80u)), "GFP_KERNEL"}, {(unsigned long)((( gfp_t)0x10u) | (( gfp_t)0x40u)),
     "GFP_NOFS"}, {(unsigned long)((( gfp_t)0x20u)), "GFP_ATOMIC"}, {(unsigned long)((( gfp_t)0x10u)), "GFP_NOIO"}, {(unsigned long)((
     gfp_t)0x20u), "GFP_HIGH"}, {(unsigned long)(( gfp_t)0x10u), "GFP_WAIT"}, {(unsigned long)(( gfp_t)0x40u), "GFP_IO"}, {(unsigned long)((
     gfp_t)0x100u), "GFP_COLD"}, {(unsigned long)(( gfp_t)0x200u), "GFP_NOWARN"}, {(unsigned long)(( gfp_t)0x400u), "GFP_REPEAT"}, {(unsigned
     long)(( gfp_t)0x800u), "GFP_NOFAIL"}, {(unsigned long)(( gfp_t)0x1000u), "GFP_NORETRY"},      {(unsigned long)(( gfp_t)0x4000u), "GFP_COMP"},
     {(unsigned long)(( gfp_t)0x8000u), "GFP_ZERO"}, {(unsigned long)(( gfp_t)0x10000u), "GFP_NOMEMALLOC"}, {(unsigned long)(( gfp_t)0x20000u),
     "GFP_HARDWALL"}, {(unsigned long)(( gfp_t)0x40000u), "GFP_THISNODE"}, {(unsigned long)(( gfp_t)0x80000u), "GFP_RECLAIMABLE"}, {(unsigned
     long)(( gfp_t)0x08u), "GFP_MOVABLE"}, {(unsigned long)(( gfp_t)0), "GFP_NOTRACK"}, {(unsigned long)(( gfp_t)0x400000u), "GFP_NO_KSWAPD"},
     {(unsigned long)(( gfp_t)0x800000u), "GFP_OTHER_NODE"} ) : "GFP_NOWAIT"
The 'enable' file in the tracepoint directory is what allows the user (or tools such as trace-cmd) to actually turn the tracepoint on and off. When enabled, the corresponding tracepoint will start appearing in the ftrace 'trace' file described previously. For example, this turns on the kmalloc tracepoint:
root@sugarbay:/sys/kernel/debug/tracing/events/kmem/kmalloc# echo 1 > enable
At the moment, we're not interested in the function tracer or some other tracer that might be in effect, so we first turn it off, but if we do that, we still need to turn tracing on in order to see the events in the output buffer:
     root@sugarbay:/sys/kernel/debug/tracing# echo nop > current_tracer
     root@sugarbay:/sys/kernel/debug/tracing# echo 1 > tracing_on
Now, if we look at the the 'trace' file, we see nothing but the kmalloc events we just turned on:
     root@sugarbay:/sys/kernel/debug/tracing# cat trace | less
     # tracer: nop
     #
     # entries-in-buffer/entries-written: 1897/1897   #P:8
     #
     #                              _-----=> irqs-off
     #                             / _----=> need-resched
     #                            | / _---=> hardirq/softirq
     #                            || / _--=> preempt-depth
     #                            ||| /     delay
     #           TASK-PID   CPU#  ||||    TIMESTAMP  FUNCTION
     #              | |       |   ||||       |         |
            dropbear-1465  [000] ...1 18154.620753: kmalloc: call_site=ffffffff816650d4 ptr=ffff8800729c3000 bytes_req=2048 bytes_alloc=2048 gfp_flags=GFP_KERNEL
              <idle>-0     [000] ..s3 18154.621640: kmalloc: call_site=ffffffff81619b36 ptr=ffff88006d555800 bytes_req=512 bytes_alloc=512 gfp_flags=GFP_ATOMIC
              <idle>-0     [000] ..s3 18154.621656: kmalloc: call_site=ffffffff81619b36 ptr=ffff88006d555800 bytes_req=512 bytes_alloc=512 gfp_flags=GFP_ATOMIC
     matchbox-termin-1361  [001] ...1 18154.755472: kmalloc: call_site=ffffffff81614050 ptr=ffff88006d5f0e00 bytes_req=512 bytes_alloc=512 gfp_flags=GFP_KERNEL|GFP_REPEAT
                Xorg-1264  [002] ...1 18154.755581: kmalloc: call_site=ffffffff8141abe8 ptr=ffff8800734f4cc0 bytes_req=168 bytes_alloc=192 gfp_flags=GFP_KERNEL|GFP_NOWARN|GFP_NORETRY
                Xorg-1264  [002] ...1 18154.755583: kmalloc: call_site=ffffffff814192a3 ptr=ffff88001f822520 bytes_req=24 bytes_alloc=32 gfp_flags=GFP_KERNEL|GFP_ZERO
                Xorg-1264  [002] ...1 18154.755589: kmalloc: call_site=ffffffff81419edb ptr=ffff8800721a2f00 bytes_req=64 bytes_alloc=64 gfp_flags=GFP_KERNEL|GFP_ZERO
     matchbox-termin-1361  [001] ...1 18155.354594: kmalloc: call_site=ffffffff81614050 ptr=ffff88006db35400 bytes_req=576 bytes_alloc=1024 gfp_flags=GFP_KERNEL|GFP_REPEAT
                Xorg-1264  [002] ...1 18155.354703: kmalloc: call_site=ffffffff8141abe8 ptr=ffff8800734f4cc0 bytes_req=168 bytes_alloc=192 gfp_flags=GFP_KERNEL|GFP_NOWARN|GFP_NORETRY
                Xorg-1264  [002] ...1 18155.354705: kmalloc: call_site=ffffffff814192a3 ptr=ffff88001f822520 bytes_req=24 bytes_alloc=32 gfp_flags=GFP_KERNEL|GFP_ZERO
                Xorg-1264  [002] ...1 18155.354711: kmalloc: call_site=ffffffff81419edb ptr=ffff8800721a2f00 bytes_req=64 bytes_alloc=64 gfp_flags=GFP_KERNEL|GFP_ZERO
              <idle>-0     [000] ..s3 18155.673319: kmalloc: call_site=ffffffff81619b36 ptr=ffff88006d555800 bytes_req=512 bytes_alloc=512 gfp_flags=GFP_ATOMIC
            dropbear-1465  [000] ...1 18155.673525: kmalloc: call_site=ffffffff816650d4 ptr=ffff8800729c3000 bytes_req=2048 bytes_alloc=2048 gfp_flags=GFP_KERNEL
              <idle>-0     [000] ..s3 18155.674821: kmalloc: call_site=ffffffff81619b36 ptr=ffff88006d554800 bytes_req=512 bytes_alloc=512 gfp_flags=GFP_ATOMIC
              <idle>-0     [000] ..s3 18155.793014: kmalloc: call_site=ffffffff81619b36 ptr=ffff88006d554800 bytes_req=512 bytes_alloc=512 gfp_flags=GFP_ATOMIC
            dropbear-1465  [000] ...1 18155.793219: kmalloc: call_site=ffffffff816650d4 ptr=ffff8800729c3000 bytes_req=2048 bytes_alloc=2048 gfp_flags=GFP_KERNEL
              <idle>-0     [000] ..s3 18155.794147: kmalloc: call_site=ffffffff81619b36 ptr=ffff88006d555800 bytes_req=512 bytes_alloc=512 gfp_flags=GFP_ATOMIC
              <idle>-0     [000] ..s3 18155.936705: kmalloc: call_site=ffffffff81619b36 ptr=ffff88006d555800 bytes_req=512 bytes_alloc=512 gfp_flags=GFP_ATOMIC
            dropbear-1465  [000] ...1 18155.936910: kmalloc: call_site=ffffffff816650d4 ptr=ffff8800729c3000 bytes_req=2048 bytes_alloc=2048 gfp_flags=GFP_KERNEL
              <idle>-0     [000] ..s3 18155.937869: kmalloc: call_site=ffffffff81619b36 ptr=ffff88006d554800 bytes_req=512 bytes_alloc=512 gfp_flags=GFP_ATOMIC
     matchbox-termin-1361  [001] ...1 18155.953667: kmalloc: call_site=ffffffff81614050 ptr=ffff88006d5f2000 bytes_req=512 bytes_alloc=512 gfp_flags=GFP_KERNEL|GFP_REPEAT
                Xorg-1264  [002] ...1 18155.953775: kmalloc: call_site=ffffffff8141abe8 ptr=ffff8800734f4cc0 bytes_req=168 bytes_alloc=192 gfp_flags=GFP_KERNEL|GFP_NOWARN|GFP_NORETRY
                Xorg-1264  [002] ...1 18155.953777: kmalloc: call_site=ffffffff814192a3 ptr=ffff88001f822520 bytes_req=24 bytes_alloc=32 gfp_flags=GFP_KERNEL|GFP_ZERO
                Xorg-1264  [002] ...1 18155.953783: kmalloc: call_site=ffffffff81419edb ptr=ffff8800721a2f00 bytes_req=64 bytes_alloc=64 gfp_flags=GFP_KERNEL|GFP_ZERO
              <idle>-0     [000] ..s3 18156.176053: kmalloc: call_site=ffffffff81619b36 ptr=ffff88006d554800 bytes_req=512 bytes_alloc=512 gfp_flags=GFP_ATOMIC
            dropbear-1465  [000] ...1 18156.176257: kmalloc: call_site=ffffffff816650d4 ptr=ffff8800729c3000 bytes_req=2048 bytes_alloc=2048 gfp_flags=GFP_KERNEL
              <idle>-0     [000] ..s3 18156.177717: kmalloc: call_site=ffffffff81619b36 ptr=ffff88006d555800 bytes_req=512 bytes_alloc=512 gfp_flags=GFP_ATOMIC
              <idle>-0     [000] ..s3 18156.399229: kmalloc: call_site=ffffffff81619b36 ptr=ffff88006d555800 bytes_req=512 bytes_alloc=512 gfp_flags=GFP_ATOMIC
            dropbear-1465  [000] ...1 18156.399434: kmalloc: call_site=ffffffff816650d4 ptr=ffff8800729c3000 bytes_http://rostedt.homelinux.com/kernelshark/req=2048 bytes_alloc=2048 gfp_flags=GFP_KERNEL
              <idle>-0     [000] ..s3 18156.400660: kmalloc: call_site=ffffffff81619b36 ptr=ffff88006d554800 bytes_req=512 bytes_alloc=512 gfp_flags=GFP_ATOMIC
     matchbox-termin-1361  [001] ...1 18156.552800: kmalloc: call_site=ffffffff81614050 ptr=ffff88006db34800 bytes_req=576 bytes_alloc=1024 gfp_flags=GFP_KERNEL|GFP_REPEAT
To again disable the kmalloc event, we need to send 0 to the enable file:
root@sugarbay:/sys/kernel/debug/tracing/events/kmem/kmalloc# echo 0 > enable
You can enable any number of events or complete subsystems (by using the 'enable' file in the subsystem directory) and get an arbitrarily fine-grained idea of what's going on in the system by enabling as many of the appropriate tracepoints as applicable.
A number of the tools described in this HOWTO do just that, including trace-cmd and kernelshark in the next section.
trace-cmd is essentially an extensive command-line 'wrapper' interface that hides the details of all the individual files in /sys/kernel/debug/tracing, allowing users to specify specific particular events within the /sys/kernel/debug/tracing/events/ subdirectory and to collect traces and avoid having to deal with those details directly.
As yet another layer on top of that, kernelshark provides a GUI that allows users to start and stop traces and specify sets of events using an intuitive interface, and view the output as both trace events and as a per-CPU graphical display. It directly uses 'trace-cmd' as the plumbing that accomplishes all that underneath the covers (and actually displays the trace-cmd command it uses, as we'll see).
To start a trace using kernelshark, first start kernelshark:
root@sugarbay:~# kernelshark
Then bring up the 'Capture' dialog by choosing from the kernelshark menu:
Capture | Record
That will display the following dialog, which allows you to choose one or more events (or even one or more complete subsystems) to trace:
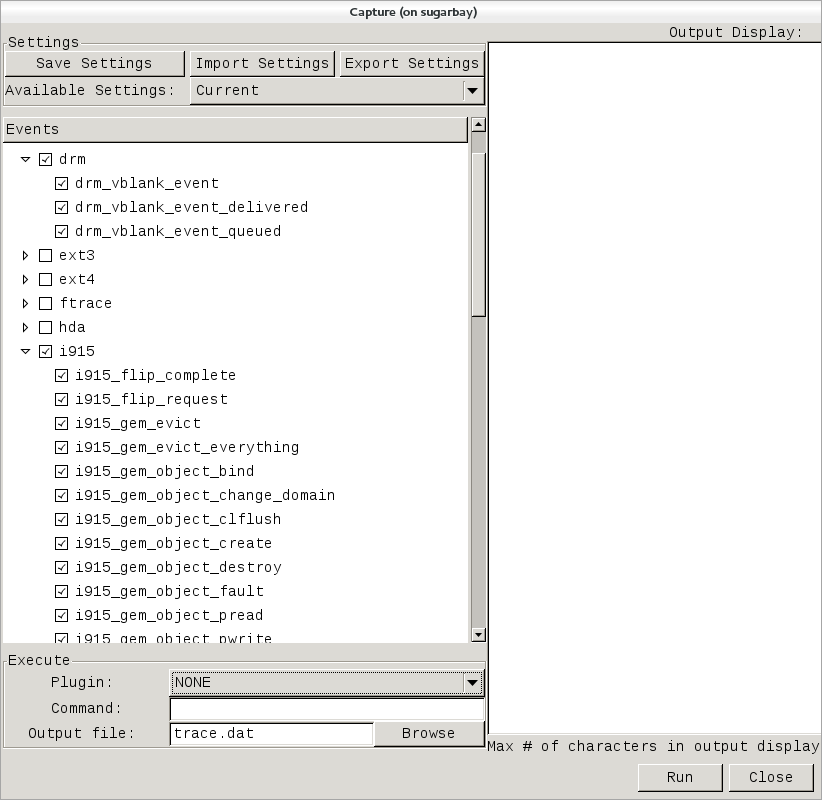 |
Note that these are exactly the same sets of events described in the previous trace events subsystem section, and in fact is where trace-cmd gets them for kernelshark.
In the above screenshot, we've decided to explore the graphics subsystem a bit and so have chosen to trace all the tracepoints contained within the 'i915' and 'drm' subsystems.
After doing that, we can start and stop the trace using the 'Run' and 'Stop' button on the lower right corner of the dialog (the same button will turn into the 'Stop' button after the trace has started):
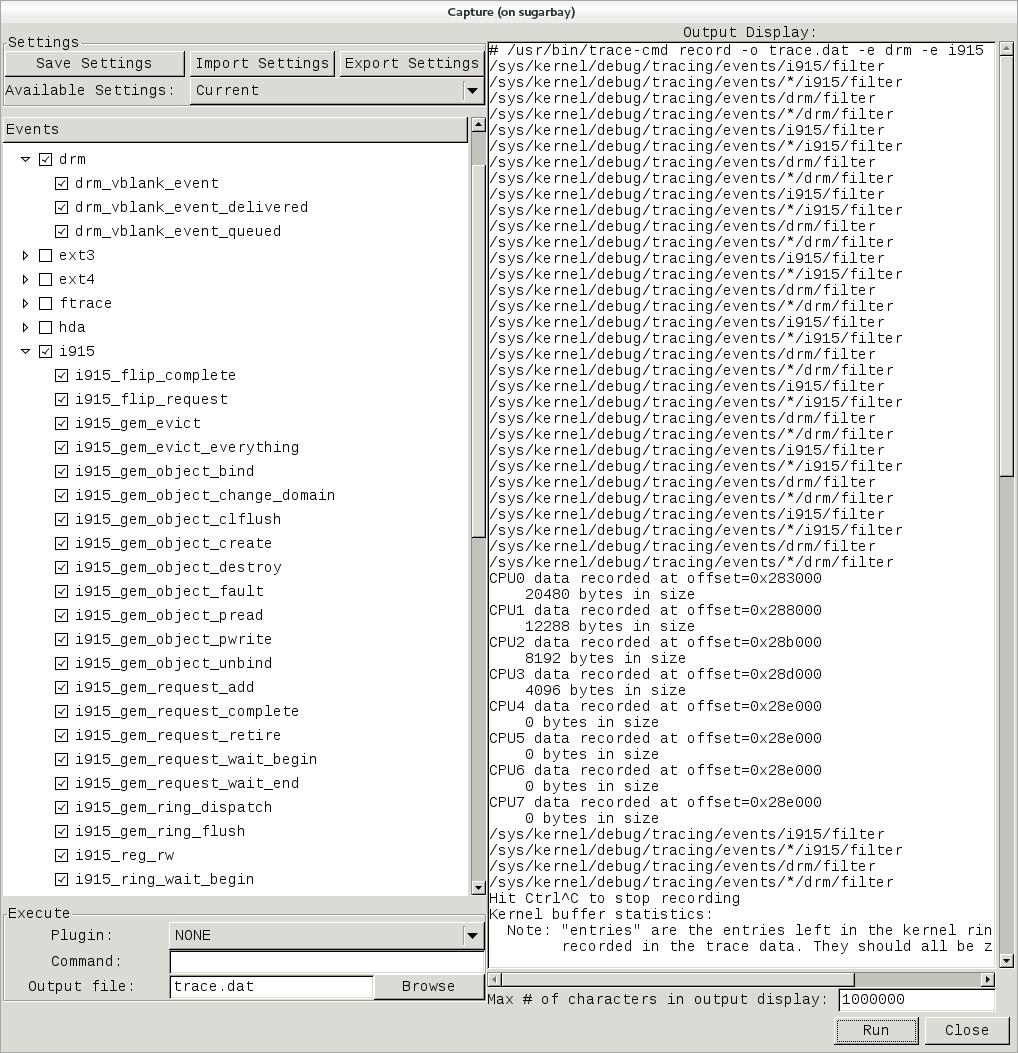 |
Notice that the right-hand pane shows the exact trace-cmd command-line that's used to run the trace, along with the results of the trace-cmd run.
Once the 'Stop' button is pressed, the graphical view magically fills up with a colorful per-cpu display of the trace data, along with the detailed event listing below that:
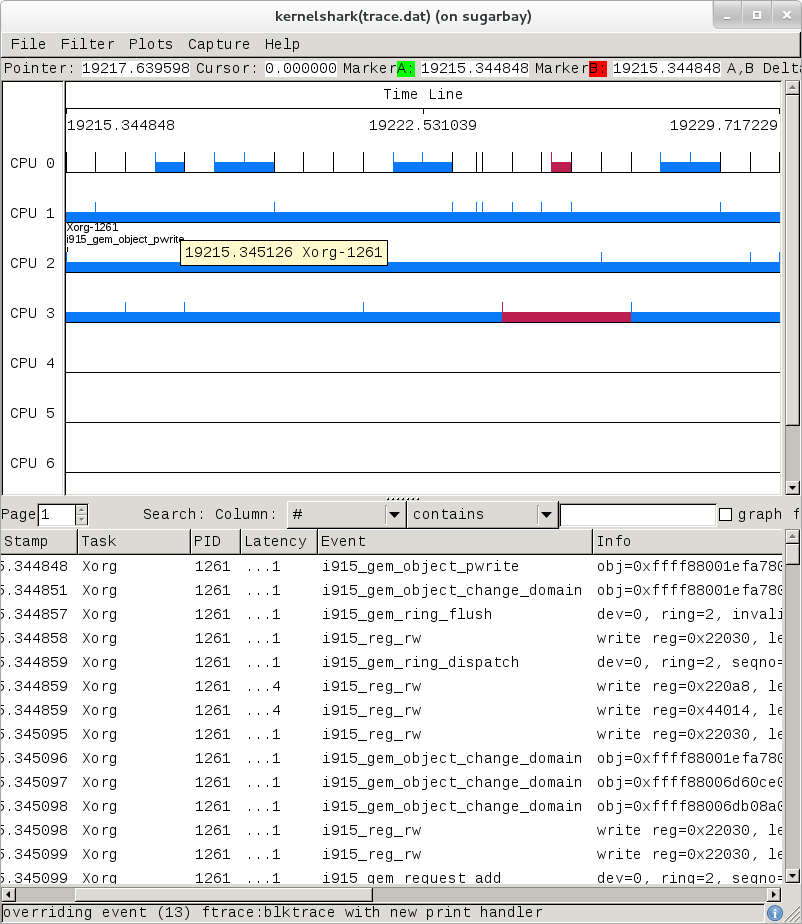 |
Here's another example, this time a display resulting from tracing 'all events':
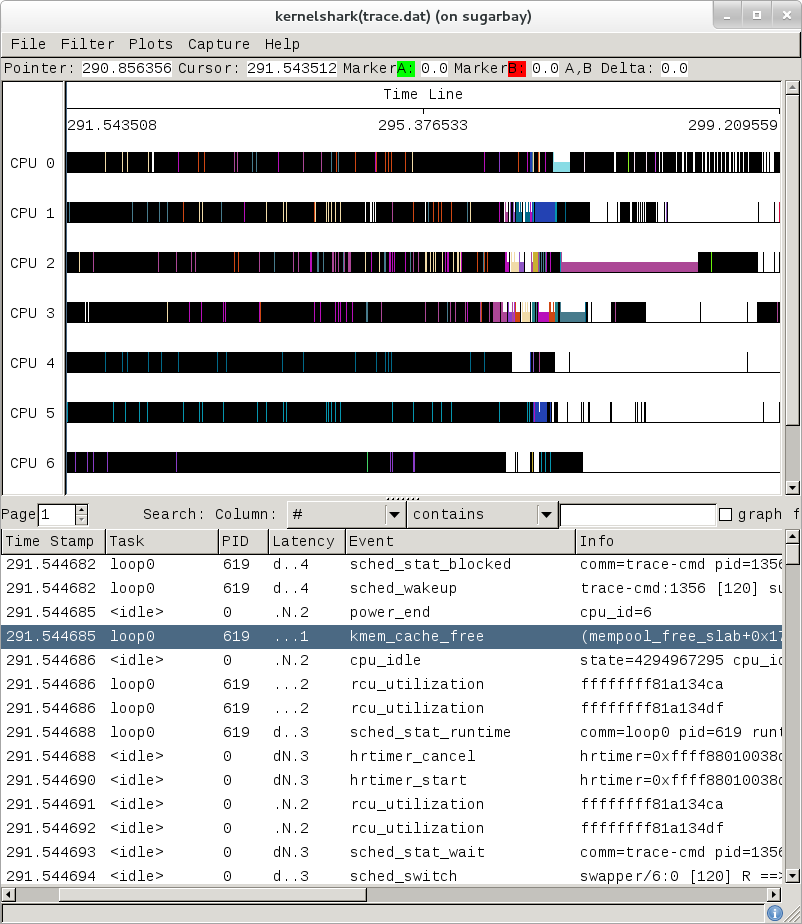 |
The tool is pretty self-explanatory, but for more detailed information on navigating through the data, see the kernelshark website.
The documentation for ftrace can be found in the kernel Documentation directory:
Documentation/trace/ftrace.txt
The documentation for the trace event subsystem can also be found in the kernel Documentation directory:
Documentation/trace/events.txt
There is a nice series of articles on using ftrace and trace-cmd at LWN:
There's more detailed documentation kernelshark usage here: KernelShark
An amusing yet useful README (a tracing mini-HOWTO) can be found in /sys/kernel/debug/tracing/README.
SystemTap is a system-wide script-based tracing and profiling tool.
SystemTap scripts are C-like programs that are executed in the kernel to gather/print/aggregate data extracted from the context they end up being invoked under.
For example, this probe from the SystemTap tutorial simply prints a line every time any process on the system open()s a file. For each line, it prints the executable name of the program that opened the file, along with its PID, and the name of the file it opened (or tried to open), which it extracts from the open syscall's argstr.
     probe syscall.open
     {
             printf ("%s(%d) open (%s)\n", execname(), pid(), argstr)
     }

     probe timer.ms(4000) # after 4 seconds
     {
             exit ()
     }
Normally, to execute this probe, you'd simply install systemtap on the system you want to probe, and directly run the probe on that system e.g. assuming the name of the file containing the above text is trace_open.stp:
# stap trace_open.stp
What systemtap does under the covers to run this probe is 1) parse and convert the probe to an equivalent 'C' form, 2) compile the 'C' form into a kernel module, 3) insert the module into the kernel, which arms it, and 4) collect the data generated by the probe and display it to the user.
In order to accomplish steps 1 and 2, the 'stap' program needs access to the kernel build system that produced the kernel that the probed system is running. In the case of a typical embedded system (the 'target'), the kernel build system unfortunately isn't typically part of the image running on the target. It is normally available on the 'host' system that produced the target image however; in such cases, steps 1 and 2 are executed on the host system, and steps 3 and 4 are executed on the target system, using only the systemtap 'runtime'.
The systemtap support in Yocto assumes that only steps 3 and 4 are run on the target; it is possible to do everything on the target, but this section assumes only the typical embedded use-case.
So basically what you need to do in order to run a systemtap script on the target is to 1) on the host system, compile the probe into a kernel module that makes sense to the target, 2) copy the module onto the target system and 3) insert the module into the target kernel, which arms it, and 4) collect the data generated by the probe and display it to the user.
Those are a lot of steps and a lot of details, but fortunately Yocto includes a script called 'crosstap' that will take care of those details, allowing you to simply execute a systemtap script on the remote target, with arguments if necessary.
In order to do this from a remote host, however, you need to have access to the build for the image you booted. The 'crosstap' script provides details on how to do this if you run the script on the host without having done a build:
Note
SystemTap, which uses 'crosstap', assumes you can establish an ssh connection to the remote target. Please refer to the crosstap wiki page for details on verifying ssh connections at https://wiki.yoctoproject.org/wiki/Tracing_and_Profiling#systemtap. Also, the ability to ssh into the target system is not enabled by default in *-minimal images.
     $ crosstap root@192.168.1.88 trace_open.stp

     Error: No target kernel build found.
     Did you forget to create a local build of your image?

     'crosstap' requires a local sdk build of the target system
     (or a build that includes 'tools-profile') in order to build
     kernel modules that can probe the target system.

     Practically speaking, that means you need to do the following:
      - If you're running a pre-built image, download the release
        and/or BSP tarballs used to build the image.
      - If you're working from git sources, just clone the metadata
        and BSP layers needed to build the image you'll be booting.
      - Make sure you're properly set up to build a new image (see
        the BSP README and/or the widely available basic documentation
        that discusses how to build images).
      - Build an -sdk version of the image e.g.:
          $ bitbake core-image-sato-sdk
      OR
      - Build a non-sdk image but include the profiling tools:
          [ edit local.conf and add 'tools-profile' to the end of
            the EXTRA_IMAGE_FEATURES variable ]
          $ bitbake core-image-sato

     Once you've build the image on the host system, you're ready to
     boot it (or the equivalent pre-built image) and use 'crosstap'
     to probe it (you need to source the environment as usual first):

        $ source oe-init-build-env
        $ cd ~/my/systemtap/scripts
        $ crosstap root@192.168.1.xxx myscript.stp
So essentially what you need to do is build an SDK image or image with 'tools-profile' as detailed in the "General Setup" section of this manual, and boot the resulting target image.
Note
If you have a build directory containing multiple machines, you need to have the MACHINE you're connecting to selected in local.conf, and the kernel in that machine's build directory must match the kernel on the booted system exactly, or you'll get the above 'crosstap' message when you try to invoke a script.Once you've done that, you should be able to run a systemtap script on the target:
     $ cd /path/to/yocto
     $ source oe-init-build-env

     ### Shell environment set up for builds. ###

     You can now run 'bitbake <target>'

     Common targets are:
        core-image-minimal
        core-image-sato
        meta-toolchain
        meta-toolchain-sdk
        adt-installer
        meta-ide-support

     You can also run generated qemu images with a command like 'runqemu qemux86'
Once you've done that, you can cd to whatever directory contains your scripts and use 'crosstap' to run the script:
     $ cd /path/to/my/systemap/script
     $ crosstap root@192.168.7.2 trace_open.stp
If you get an error connecting to the target e.g.:
     $ crosstap root@192.168.7.2 trace_open.stp
     error establishing ssh connection on remote 'root@192.168.7.2'
Try ssh'ing to the target and see what happens:
$ ssh root@192.168.7.2
A lot of the time, connection problems are due specifying a wrong IP address or having a 'host key verification error'.
If everything worked as planned, you should see something like this (enter the password when prompted, or press enter if it's set up to use no password):
     $ crosstap root@192.168.7.2 trace_open.stp
     root@192.168.7.2's password:
     matchbox-termin(1036) open ("/tmp/vte3FS2LW", O_RDWR|O_CREAT|O_EXCL|O_LARGEFILE, 0600)
     matchbox-termin(1036) open ("/tmp/vteJMC7LW", O_RDWR|O_CREAT|O_EXCL|O_LARGEFILE, 0600)
The SystemTap language reference can be found here: SystemTap Language Reference
Links to other SystemTap documents, tutorials, and examples can be found here: SystemTap documentation page
oprofile itself is a command-line application that runs on the target system.
For this section, we'll assume you've already performed the basic setup outlined in the "General Setup" section.
For the section that deals with running oprofile from the command-line, we assume you've ssh'ed to the host and will be running oprofile on the target.
oprofileui (oprofile-viewer) is a GUI-based program that runs on the host and interacts remotely with the target. See the oprofileui section for the exact steps needed to install oprofileui on the host.
Oprofile as configured in Yocto is a system-wide profiler (i.e. the version in Yocto doesn't yet make use of the perf_events interface which would allow it to profile specific processes and workloads). It relies on hardware counter support in the hardware (but can fall back to a timer-based mode), which means that it doesn't take advantage of tracepoints or other event sources for example.
It consists of a kernel module that collects samples and a userspace daemon that writes the sample data to disk.
The 'opcontrol' shell script is used for transparently managing these components and starting and stopping profiles, and the 'opreport' command is used to display the results.
The oprofile daemon should already be running, but before you start profiling, you may need to change some settings and some of these settings may require the daemon to not be running. One of these settings is the path to the vmlinux file, which you'll want to set using the --vmlinux option if you want the kernel profiled:
     root@crownbay:~# opcontrol --vmlinux=/boot/vmlinux-`uname -r`
     The profiling daemon is currently active, so changes to the configuration
     will be used the next time you restart oprofile after a --shutdown or --deinit.
You can check if vmlinux file: is set using opcontrol --status:
     root@crownbay:~# opcontrol --status
     Daemon paused: pid 1334
     Separate options: library
     vmlinux file: none
     Image filter: none
     Call-graph depth: 6
If it's not, you need to shutdown the daemon, add the setting and restart the daemon:
     root@crownbay:~# opcontrol --shutdown
     Killing daemon.

     root@crownbay:~# opcontrol --vmlinux=/boot/vmlinux-`uname -r`
     root@crownbay:~# opcontrol --start-daemon
     Using default event: CPU_CLK_UNHALTED:100000:0:1:1
     Using 2.6+ OProfile kernel interface.
     Reading module info.
     Using log file /var/lib/oprofile/samples/oprofiled.log
     Daemon started.
If we check the status again we now see our updated settings:
     root@crownbay:~# opcontrol --status
     Daemon paused: pid 1649
     Separate options: library
     vmlinux file: /boot/vmlinux-3.4.11-yocto-standard
     Image filter: none
     Call-graph depth: 6
We're now in a position to run a profile. For that we use 'opcontrol --start':
     root@crownbay:~# opcontrol --start
     Profiler running.
In another window, run our wget workload:
     root@crownbay:~# rm linux-2.6.19.2.tar.bz2; wget http://downloads.yoctoproject.org/mirror/sources/linux-2.6.19.2.tar.bz2; sync
     Connecting to downloads.yoctoproject.org (140.211.169.59:80)
     linux-2.6.19.2.tar.b 100% |*******************************| 41727k  0:00:00 ETA
To stop the profile we use 'opcontrol --shutdown', which not only stops the profile but shuts down the daemon as well:
     root@crownbay:~# opcontrol --shutdown
     Stopping profiling.
     Killing daemon.
Oprofile writes sample data to /var/lib/oprofile/samples, which you can look at if you're interested in seeing how the samples are structured. This is also interesting because it's related to how you dive down to get further details about specific executables in OProfile.
To see the default display output for a profile, simply type 'opreport', which will show the results using the data in /var/lib/oprofile/samples:
     root@crownbay:~# opreport

     WARNING! The OProfile kernel driver reports sample buffer overflows.
     Such overflows can result in incorrect sample attribution, invalid sample
     files and other symptoms.  See the oprofiled.log for details.
     You should adjust your sampling frequency to eliminate (or at least minimize)
     these overflows.
     CPU: Intel Architectural Perfmon, speed 1.3e+06 MHz (estimated)
     Counted CPU_CLK_UNHALTED events (Clock cycles when not halted) with a unit mask of 0x00 (No unit mask) count 100000
     CPU_CLK_UNHALT...|
      samples|      %|
     ------------------
       464365 79.8156 vmlinux-3.4.11-yocto-standard
        65108 11.1908 oprofiled
	     CPU_CLK_UNHALT...|
	       samples|      %|
 	     ------------------
 	         64416 98.9372 oprofiled
 	           692  1.0628 libc-2.16.so
        36959  6.3526 no-vmlinux
         4378  0.7525 busybox
	     CPU_CLK_UNHALT...|
	       samples|      %|
	     ------------------
	          2844 64.9612 libc-2.16.so
	          1337 30.5391 busybox
	           193  4.4084 ld-2.16.so
	             2  0.0457 libnss_compat-2.16.so
	             1  0.0228 libnsl-2.16.so
	             1  0.0228 libnss_files-2.16.so
         4344  0.7467 bash
	     CPU_CLK_UNHALT...|
	       samples|      %|
	     ------------------
	          2657 61.1648 bash
	          1665 38.3287 libc-2.16.so
	            18  0.4144 ld-2.16.so
	             3  0.0691 libtinfo.so.5.9
	             1  0.0230 libdl-2.16.so
         3118  0.5359 nf_conntrack
          686  0.1179 matchbox-terminal
	     CPU_CLK_UNHALT...|
	       samples|      %|
	     ------------------
	           214 31.1953 libglib-2.0.so.0.3200.4
	           114 16.6181 libc-2.16.so
	            79 11.5160 libcairo.so.2.11200.2
	            78 11.3703 libgdk-x11-2.0.so.0.2400.8
	            51  7.4344 libpthread-2.16.so
	            45  6.5598 libgobject-2.0.so.0.3200.4
	            29  4.2274 libvte.so.9.2800.2
	            25  3.6443 libX11.so.6.3.0
	            19  2.7697 libxcb.so.1.1.0
	            17  2.4781 libgtk-x11-2.0.so.0.2400.8
	            12  1.7493 librt-2.16.so
	             3  0.4373 libXrender.so.1.3.0
          671  0.1153 emgd
          411  0.0706 nf_conntrack_ipv4
          391  0.0672 iptable_nat
          378  0.0650 nf_nat
          263  0.0452 Xorg
	     CPU_CLK_UNHALT...|
	       samples|      %|
	     ------------------
	           106 40.3042 Xorg
	            53 20.1521 libc-2.16.so
	            31 11.7871 libpixman-1.so.0.27.2
	            26  9.8859 emgd_drv.so
	            16  6.0837 libemgdsrv_um.so.1.5.15.3226
	            11  4.1825 libEMGD2d.so.1.5.15.3226
	             9  3.4221 libfb.so
	             7  2.6616 libpthread-2.16.so
	             1  0.3802 libudev.so.0.9.3
	             1  0.3802 libdrm.so.2.4.0
	             1  0.3802 libextmod.so
	             1  0.3802 mouse_drv.so
     .
     .
     .
           9  0.0015 connmand
	     CPU_CLK_UNHALT...|
	       samples|      %|
	     ------------------
	             4 44.4444 libglib-2.0.so.0.3200.4
	             2 22.2222 libpthread-2.16.so
	             1 11.1111 connmand
	             1 11.1111 libc-2.16.so
	             1 11.1111 librt-2.16.so
            6  0.0010 oprofile-server
     	 CPU_CLK_UNHALT...|
	       samples|      %|
	     ------------------
	             3 50.0000 libc-2.16.so
	             1 16.6667 oprofile-server
	             1 16.6667 libpthread-2.16.so
	             1 16.6667 libglib-2.0.so.0.3200.4
           5 8.6e-04 gconfd-2
	     CPU_CLK_UNHALT...|
	       samples|      %|
	     ------------------
	             2 40.0000 libdbus-1.so.3.7.2
	             2 40.0000 libglib-2.0.so.0.3200.4
	             1 20.0000 libc-2.16.so
The output above shows the breakdown or samples by both number of samples and percentage for each executable. Within an executable, the sample counts are broken down further into executable and shared libraries (DSOs) used by the executable.
To get even more detailed breakdowns by function, we need to have the full paths to the DSOs, which we can get by using -f with opreport:
     root@crownbay:~# opreport -f

     CPU: Intel Architectural Perfmon, speed 1.3e+06 MHz (estimated)
     Counted CPU_CLK_UNHALTED events (Clock cycles when not halted) with a unit mask of 0x00 (No unit mask) count 100000
     CPU_CLK_UNHALT...|
      samples|      %|

       464365 79.8156 /boot/vmlinux-3.4.11-yocto-standard
       65108 11.1908 /usr/bin/oprofiled
	     CPU_CLK_UNHALT...|
	       samples|      %|
	     ------------------
	         64416 98.9372 /usr/bin/oprofiled
	           692  1.0628 /lib/libc-2.16.so
        36959  6.3526 /no-vmlinux
         4378  0.7525 /bin/busybox
	     CPU_CLK_UNHALT...|
	       samples|      %|
	     ------------------
	          2844 64.9612 /lib/libc-2.16.so
	          1337 30.5391 /bin/busybox
	           193  4.4084 /lib/ld-2.16.so
	             2  0.0457 /lib/libnss_compat-2.16.so
	             1  0.0228 /lib/libnsl-2.16.so
	             1  0.0228 /lib/libnss_files-2.16.so
         4344  0.7467 /bin/bash
	     CPU_CLK_UNHALT...|
	       samples|      %|
	     ------------------
	          2657 61.1648 /bin/bash
	          1665 38.3287 /lib/libc-2.16.so
	            18  0.4144 /lib/ld-2.16.so
	             3  0.0691 /lib/libtinfo.so.5.9
	             1  0.0230 /lib/libdl-2.16.so
     .
     .
     .
Using the paths shown in the above output and the -l option to opreport, we can see all the functions that have hits in the profile and their sample counts and percentages. Here's a portion of what we get for the kernel:
     root@crownbay:~# opreport -l /boot/vmlinux-3.4.11-yocto-standard

     CPU: Intel Architectural Perfmon, speed 1.3e+06 MHz (estimated)
     Counted CPU_CLK_UNHALTED events (Clock cycles when not halted) with a unit mask of 0x00 (No unit mask) count 100000
     samples  %        symbol name
     233981   50.3873  intel_idle
     15437     3.3243  rb_get_reader_page
     14503     3.1232  ring_buffer_consume
     14092     3.0347  mutex_spin_on_owner
     13024     2.8047  read_hpet
     8039      1.7312  sub_preempt_count
     7096      1.5281  ioread32
     6997      1.5068  add_preempt_count
     3985      0.8582  rb_advance_reader
     3488      0.7511  add_event_entry
     3303      0.7113  get_parent_ip
     3104      0.6684  rb_buffer_peek
     2960      0.6374  op_cpu_buffer_read_entry
     2614      0.5629  sync_buffer
     2545      0.5481  debug_smp_processor_id
     2456      0.5289  ohci_irq
     2397      0.5162  memset
     2349      0.5059  __copy_to_user_ll
     2185      0.4705  ring_buffer_event_length
     1918      0.4130  in_lock_functions
     1850      0.3984  __schedule
     1767      0.3805  __copy_from_user_ll_nozero
     1575      0.3392  rb_event_data_length
     1256      0.2705  memcpy
     1233      0.2655  system_call
     1213      0.2612  menu_select
Notice that above we see an entry for the __copy_to_user_ll() function that we've looked at with other profilers as well.
Here's what we get when we do the same thing for the busybox executable:
     CPU: Intel Architectural Perfmon, speed 1.3e+06 MHz (estimated)
     Counted CPU_CLK_UNHALTED events (Clock cycles when not halted) with a unit mask of 0x00 (No unit mask) count 100000
     samples  %        image name               symbol name
     349       8.4198  busybox                  retrieve_file_data
     308       7.4306  libc-2.16.so             _IO_file_xsgetn
     283       6.8275  libc-2.16.so             __read_nocancel
     235       5.6695  libc-2.16.so             syscall
     233       5.6212  libc-2.16.so             clearerr
     215       5.1870  libc-2.16.so             fread
     181       4.3667  libc-2.16.so             __write_nocancel
     158       3.8118  libc-2.16.so             __underflow
     151       3.6429  libc-2.16.so             _dl_addr
     150       3.6188  busybox                  progress_meter
     150       3.6188  libc-2.16.so             __poll_nocancel
     148       3.5706  libc-2.16.so             _IO_file_underflow@@GLIBC_2.1
     137       3.3052  busybox                  safe_poll
     125       3.0157  busybox                  bb_progress_update
     122       2.9433  libc-2.16.so             __x86.get_pc_thunk.bx
     95        2.2919  busybox                  full_write
     81        1.9542  busybox                  safe_write
     77        1.8577  busybox                  xwrite
     72        1.7370  libc-2.16.so             _IO_file_read
     71        1.7129  libc-2.16.so             _IO_sgetn
     67        1.6164  libc-2.16.so             poll
     52        1.2545  libc-2.16.so             _IO_switch_to_get_mode
     45        1.0856  libc-2.16.so             read
     34        0.8203  libc-2.16.so             write
     32        0.7720  busybox                  monotonic_sec
     25        0.6031  libc-2.16.so             vfprintf
     22        0.5308  busybox                  get_mono
     14        0.3378  ld-2.16.so               strcmp
     14        0.3378  libc-2.16.so             __x86.get_pc_thunk.cx
     .
     .
     .
Since we recorded the profile with a callchain depth of 6, we should be able to see our __copy_to_user_ll() callchains in the output, and indeed we can if we search around a bit in the 'opreport --callgraph' output:
     root@crownbay:~# opreport --callgraph /boot/vmlinux-3.4.11-yocto-standard

       392       6.9639  vmlinux-3.4.11-yocto-standard sock_aio_read
       736      13.0751  vmlinux-3.4.11-yocto-standard __generic_file_aio_write
       3255     57.8255  vmlinux-3.4.11-yocto-standard inet_recvmsg
     785       0.1690  vmlinux-3.4.11-yocto-standard tcp_recvmsg
       1790     31.7940  vmlinux-3.4.11-yocto-standard local_bh_enable
       1238     21.9893  vmlinux-3.4.11-yocto-standard __kfree_skb
       992      17.6199  vmlinux-3.4.11-yocto-standard lock_sock_nested
       785      13.9432  vmlinux-3.4.11-yocto-standard tcp_recvmsg [self]
       525       9.3250  vmlinux-3.4.11-yocto-standard release_sock
       112       1.9893  vmlinux-3.4.11-yocto-standard tcp_cleanup_rbuf
       72        1.2789  vmlinux-3.4.11-yocto-standard skb_copy_datagram_iovec

     170       0.0366  vmlinux-3.4.11-yocto-standard skb_copy_datagram_iovec
       1491     73.3038  vmlinux-3.4.11-yocto-standard memcpy_toiovec
       327      16.0767  vmlinux-3.4.11-yocto-standard skb_copy_datagram_iovec
       170       8.3579  vmlinux-3.4.11-yocto-standard skb_copy_datagram_iovec [self]
       20        0.9833  vmlinux-3.4.11-yocto-standard copy_to_user

       2588     98.2909  vmlinux-3.4.11-yocto-standard copy_to_user
     2349      0.5059  vmlinux-3.4.11-yocto-standard __copy_to_user_ll
       2349     89.2138  vmlinux-3.4.11-yocto-standard __copy_to_user_ll [self]
       166       6.3046  vmlinux-3.4.11-yocto-standard do_page_fault
Remember that by default OProfile sessions are cumulative i.e. if you start and stop a profiling session, then start a new one, the new one will not erase the previous run(s) but will build on it. If you want to restart a profile from scratch, you need to reset:
root@crownbay:~# opcontrol --reset
Yocto also supports a graphical UI for controlling and viewing OProfile traces, called OProfileUI. To use it, you first need to clone the oprofileui git repo, then configure, build, and install it:
     [trz@empanada tmp]$ git clone git://git.yoctoproject.org/oprofileui
     [trz@empanada tmp]$ cd oprofileui
     [trz@empanada oprofileui]$ ./autogen.sh
     [trz@empanada oprofileui]$ sudo make install
OprofileUI replaces the 'opreport' functionality with a GUI, and normally doesn't require the user to use 'opcontrol' either. If you want to profile the kernel, however, you need to either use the UI to specify a vmlinux or use 'opcontrol' to specify it on the target:
First, on the target, check if vmlinux file: is set:
root@crownbay:~# opcontrol --status
If not:
     root@crownbay:~# opcontrol --shutdown
     root@crownbay:~# opcontrol --vmlinux=/boot/vmlinux-`uname -r`
     root@crownbay:~# opcontrol --start-daemon
Now, start the oprofile UI on the host system:
[trz@empanada oprofileui]$ oprofile-viewer
To run a profile on the remote system, first connect to the remote system by pressing the 'Connect' button and supplying the IP address and port of the remote system (the default port is 4224).
The oprofile server should automatically be started already. If not, the connection will fail and you either typed in the wrong IP address and port (see below), or you need to start the server yourself:
root@crownbay:~# oprofile-server
Or, to specify a specific port:
root@crownbay:~# oprofile-server --port 8888
Once connected, press the 'Start' button and then run the wget workload on the remote system:
     root@crownbay:~# rm linux-2.6.19.2.tar.bz2; wget http://downloads.yoctoproject.org/mirror/sources/linux-2.6.19.2.tar.bz2; sync
     Connecting to downloads.yoctoproject.org (140.211.169.59:80)
     linux-2.6.19.2.tar.b 100% |*******************************| 41727k  0:00:00 ETA
Once the workload completes, press the 'Stop' button. At that point the OProfile viewer will download the profile files it's collected (this may take some time, especially if the kernel was profiled). While it downloads the files, you should see something like the following:
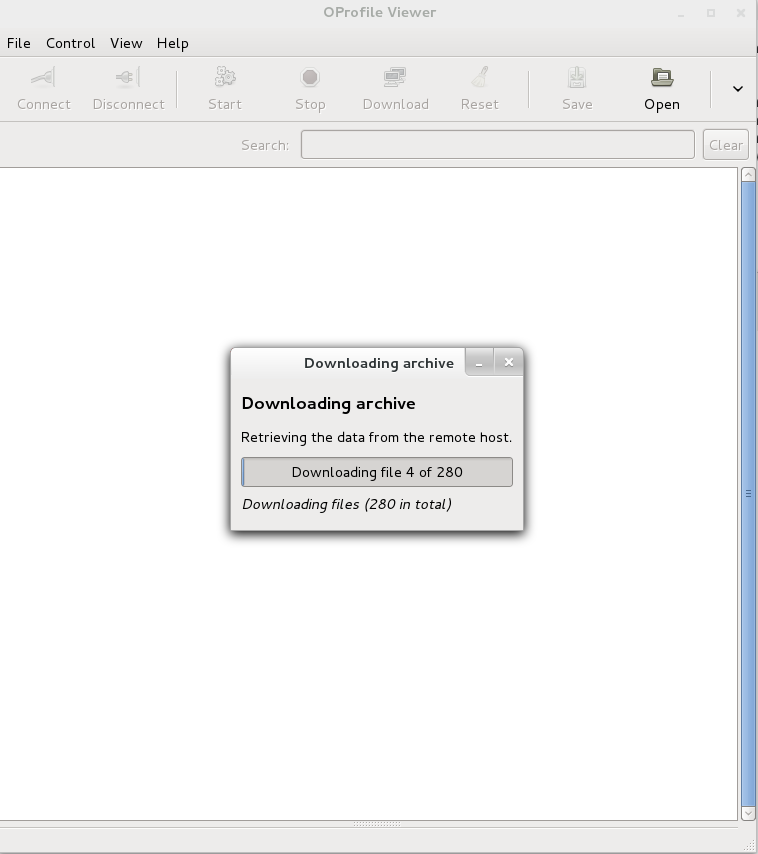 |
Once the profile files have been retrieved, you should see a list of the processes that were profiled:
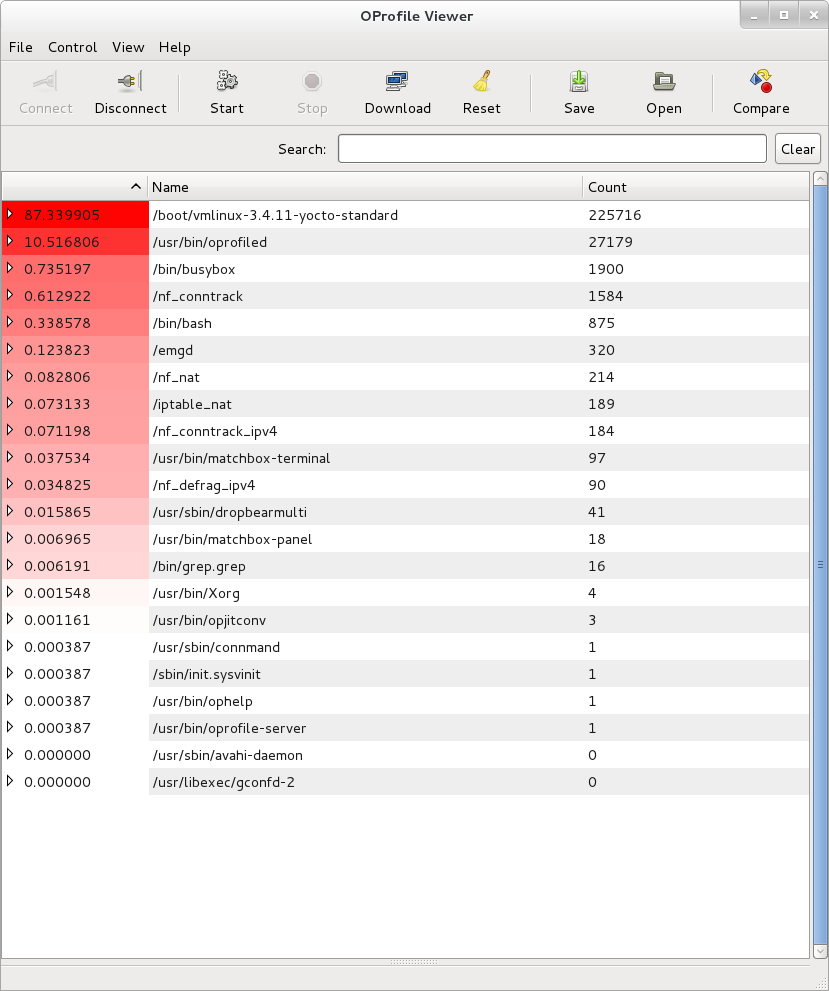 |
If you select one of them, you should see all the symbols that were hit during the profile. Selecting one of them will show a list of callers and callees of the chosen function in two panes below the top pane. For example, here's what we see when we select __copy_to_user_ll():
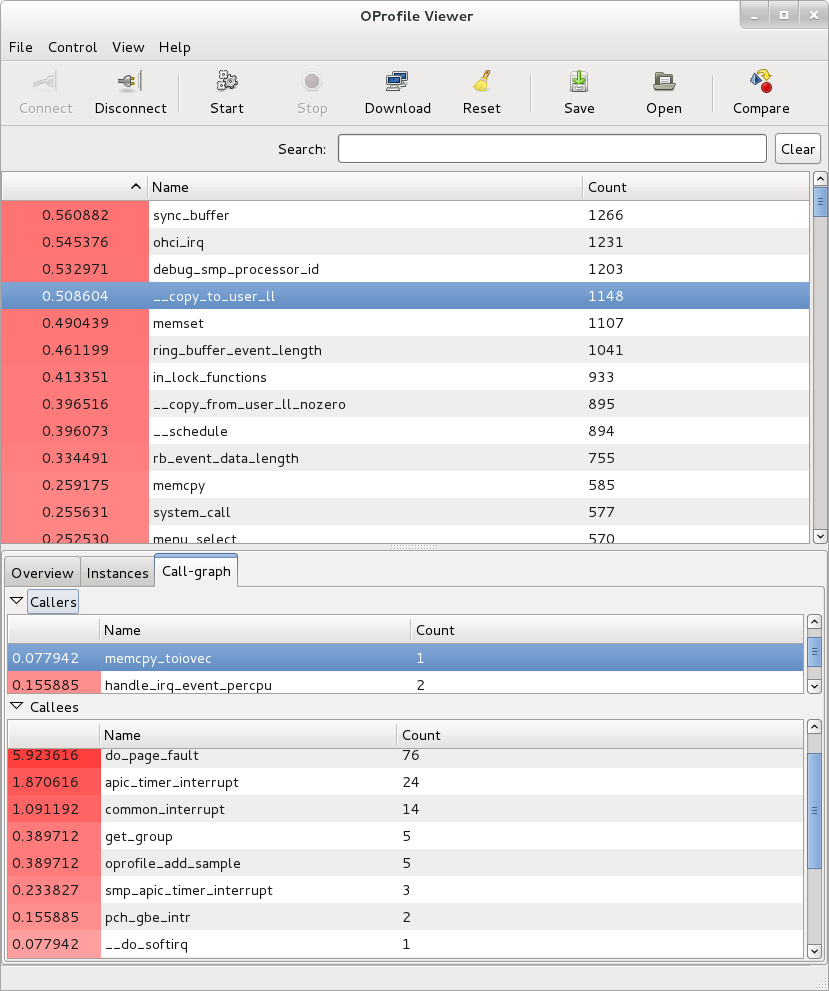 |
As another example, we can look at the busybox process and see that the progress meter made a system call:
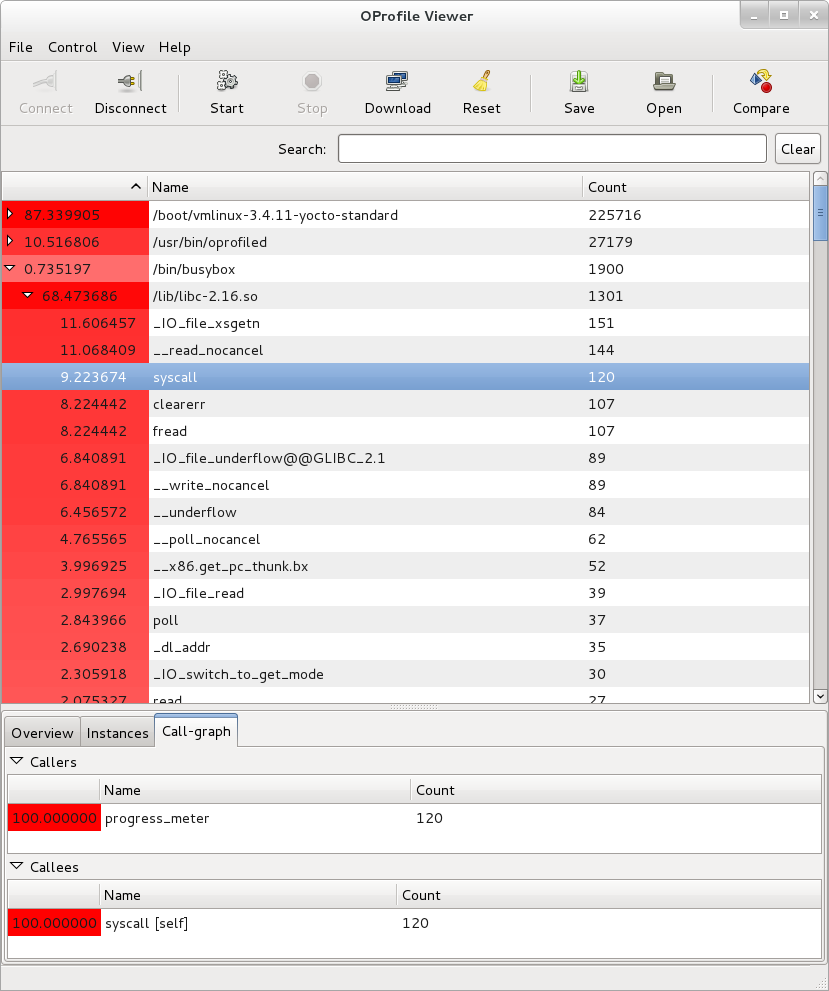 |
Yocto already has some information on setting up and using OProfile and oprofileui. As this document doesn't cover everything in detail, it may be worth taking a look at the "Profiling with OProfile" section in the Yocto Project Development Manual
The OProfile manual can be found here: OProfile manual
The OProfile website contains links to the above manual and bunch of other items including an extensive set of examples: About OProfile
Sysprof is a very easy to use system-wide profiler that consists of a single window with three panes and a few buttons which allow you to start, stop, and view the profile from one place.
For this section, we'll assume you've already performed the basic setup outlined in the General Setup section.
Sysprof is a GUI-based application that runs on the target system. For the rest of this document we assume you've ssh'ed to the host and will be running Sysprof on the target (you can use the '-X' option to ssh and have the Sysprof GUI run on the target but display remotely on the host if you want).
To start profiling the system, you simply press the 'Start' button. To stop profiling and to start viewing the profile data in one easy step, press the 'Profile' button.
Once you've pressed the profile button, the three panes will fill up with profiling data:
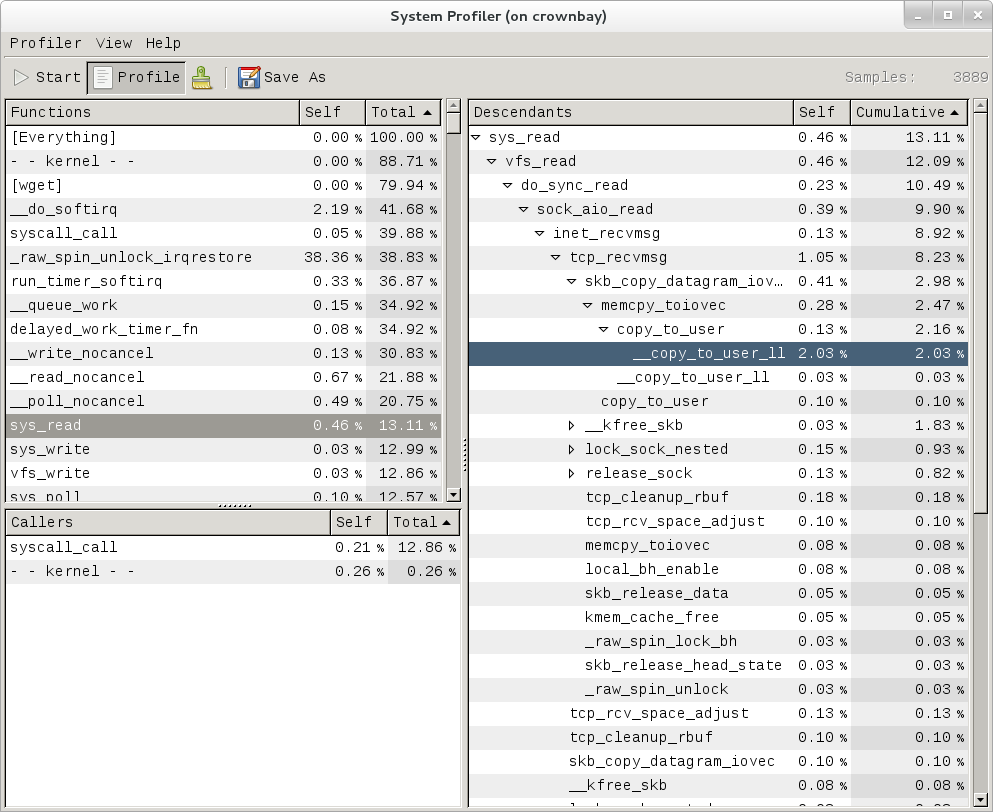 |
The left pane shows a list of functions and processes. Selecting one of those expands that function in the right pane, showing all its callees. Note that this caller-oriented display is essentially the inverse of perf's default callee-oriented callchain display.
In the screenshot above, we're focusing on __copy_to_user_ll() and looking up the callchain we can see that one of the callers of __copy_to_user_ll is sys_read() and the complete callpath between them. Notice that this is essentially a portion of the same information we saw in the perf display shown in the perf section of this page.
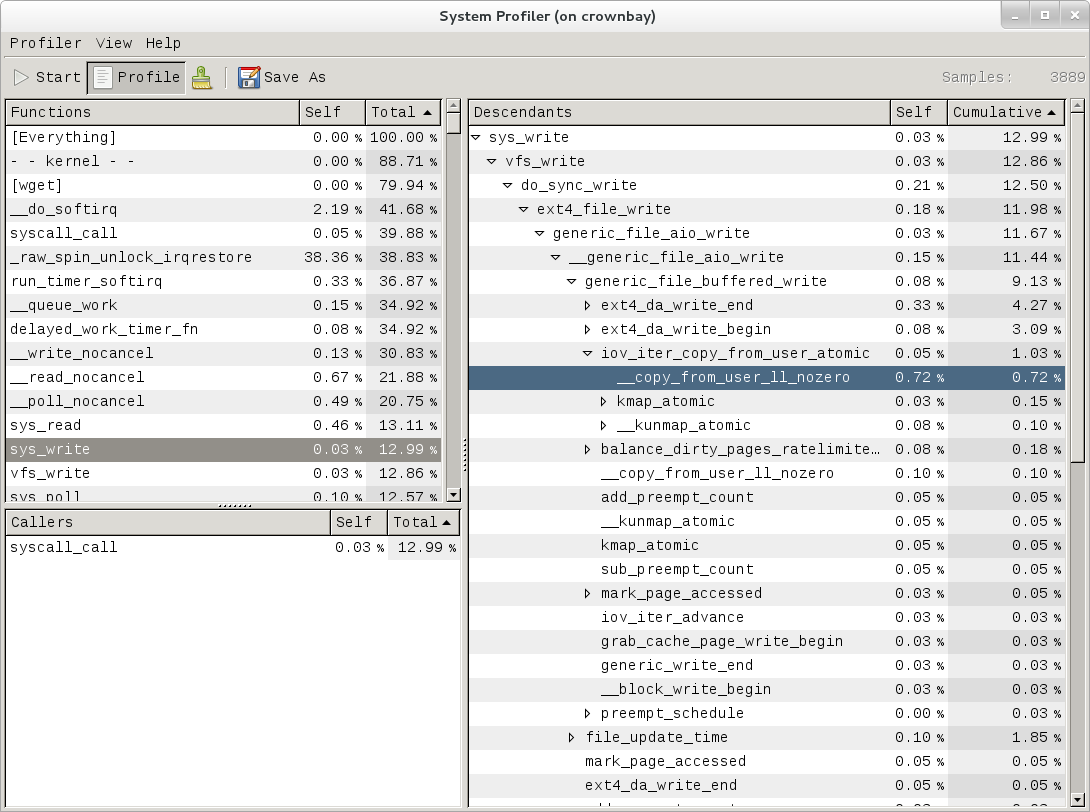 |
Similarly, the above is a snapshot of the Sysprof display of a copy-from-user callchain.
Finally, looking at the third Sysprof pane in the lower left, we can see a list of all the callers of a particular function selected in the top left pane. In this case, the lower pane is showing all the callers of __mark_inode_dirty:
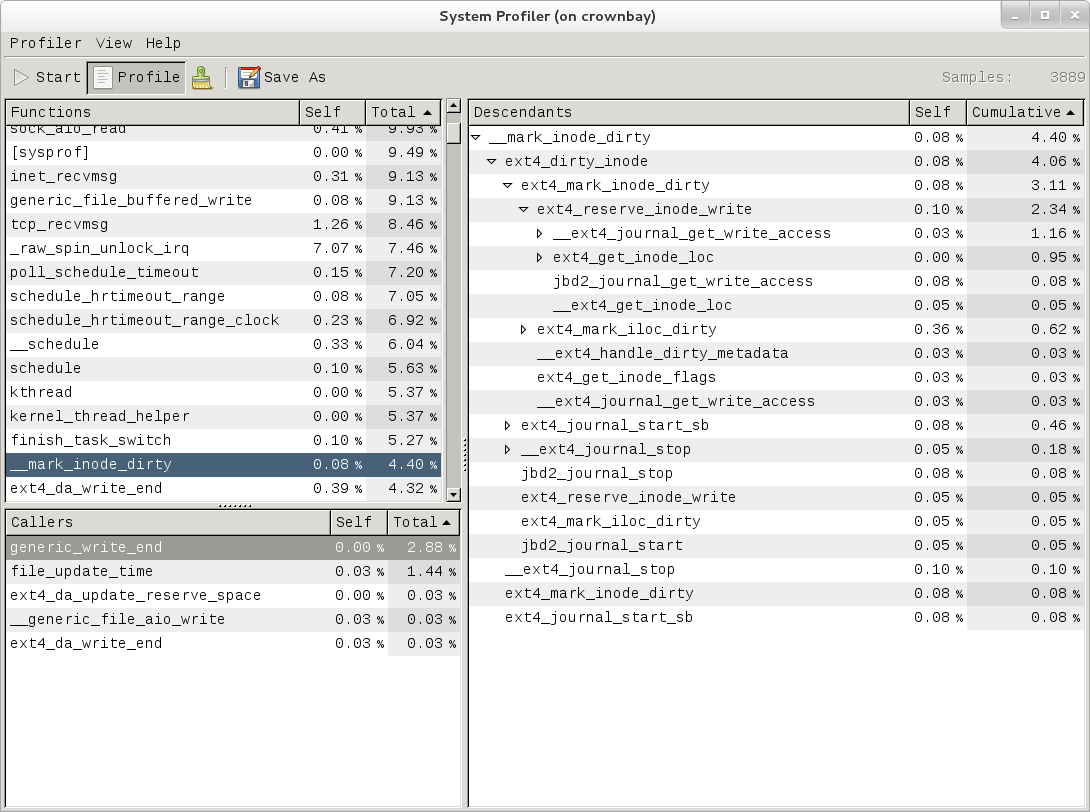 |
Double-clicking on one of those functions will in turn change the focus to the selected function, and so on.
There doesn't seem to be any documentation for Sysprof, but maybe that's because it's pretty self-explanatory. The Sysprof website, however, is here: Sysprof, System-wide Performance Profiler for Linux
For this section, we'll assume you've already performed the basic setup outlined in the General Setup section.
LTTng is run on the target system by ssh'ing to it. However, if you want to see the traces graphically, install Eclipse as described in section "Manually copying a trace to the host and viewing it in Eclipse (i.e. using Eclipse without network support)" and follow the directions to manually copy traces to the host and view them in Eclipse (i.e. using Eclipse without network support).
Note
Be sure to download and install/run the 'SR1' or later Juno release of eclipse e.g.: http://www.eclipse.org/downloads/download.php?file=/technology/epp/downloads/release/juno/SR1/eclipse-cpp-juno-SR1-linux-gtk-x86_64.tar.gzOnce you've applied the above commits and built and booted your image (you need to build the core-image-sato-sdk image or use one of the other methods described in the General Setup section), you're ready to start tracing.
First, from the host, ssh to the target:
     $ ssh -l root 192.168.1.47
     The authenticity of host '192.168.1.47 (192.168.1.47)' can't be established.
     RSA key fingerprint is 23:bd:c8:b1:a8:71:52:00:ee:00:4f:64:9e:10:b9:7e.
     Are you sure you want to continue connecting (yes/no)? yes
     Warning: Permanently added '192.168.1.47' (RSA) to the list of known hosts.
     root@192.168.1.47's password:
Once on the target, use these steps to create a trace:
     root@crownbay:~# lttng create
     Spawning a session daemon
     Session auto-20121015-232120 created.
     Traces will be written in /home/root/lttng-traces/auto-20121015-232120
Enable the events you want to trace (in this case all kernel events):
     root@crownbay:~# lttng enable-event --kernel --all
     All kernel events are enabled in channel channel0
Start the trace:
     root@crownbay:~# lttng start
     Tracing started for session auto-20121015-232120
And then stop the trace after awhile or after running a particular workload that you want to trace:
     root@crownbay:~# lttng stop
     Tracing stopped for session auto-20121015-232120
You can now view the trace in text form on the target:
     root@crownbay:~# lttng view
     [23:21:56.989270399] (+?.?????????) sys_geteuid: { 1 }, { }
     [23:21:56.989278081] (+0.000007682) exit_syscall: { 1 }, { ret = 0 }
     [23:21:56.989286043] (+0.000007962) sys_pipe: { 1 }, { fildes = 0xB77B9E8C }
     [23:21:56.989321802] (+0.000035759) exit_syscall: { 1 }, { ret = 0 }
     [23:21:56.989329345] (+0.000007543) sys_mmap_pgoff: { 1 }, { addr = 0x0, len = 10485760, prot = 3, flags = 131362, fd = 4294967295, pgoff = 0 }
     [23:21:56.989351694] (+0.000022349) exit_syscall: { 1 }, { ret = -1247805440 }
     [23:21:56.989432989] (+0.000081295) sys_clone: { 1 }, { clone_flags = 0x411, newsp = 0xB5EFFFE4, parent_tid = 0xFFFFFFFF, child_tid = 0x0 }
     [23:21:56.989477129] (+0.000044140) sched_stat_runtime: { 1 }, { comm = "lttng-consumerd", tid = 1193, runtime = 681660, vruntime = 43367983388 }
     [23:21:56.989486697] (+0.000009568) sched_migrate_task: { 1 }, { comm = "lttng-consumerd", tid = 1193, prio = 20, orig_cpu = 1, dest_cpu = 1 }
     [23:21:56.989508418] (+0.000021721) hrtimer_init: { 1 }, { hrtimer = 3970832076, clockid = 1, mode = 1 }
     [23:21:56.989770462] (+0.000262044) hrtimer_cancel: { 1 }, { hrtimer = 3993865440 }
     [23:21:56.989771580] (+0.000001118) hrtimer_cancel: { 0 }, { hrtimer = 3993812192 }
     [23:21:56.989776957] (+0.000005377) hrtimer_expire_entry: { 1 }, { hrtimer = 3993865440, now = 79815980007057, function = 3238465232 }
     [23:21:56.989778145] (+0.000001188) hrtimer_expire_entry: { 0 }, { hrtimer = 3993812192, now = 79815980008174, function = 3238465232 }
     [23:21:56.989791695] (+0.000013550) softirq_raise: { 1 }, { vec = 1 }
     [23:21:56.989795396] (+0.000003701) softirq_raise: { 0 }, { vec = 1 }
     [23:21:56.989800635] (+0.000005239) softirq_raise: { 0 }, { vec = 9 }
     [23:21:56.989807130] (+0.000006495) sched_stat_runtime: { 1 }, { comm = "lttng-consumerd", tid = 1193, runtime = 330710, vruntime = 43368314098 }
     [23:21:56.989809993] (+0.000002863) sched_stat_runtime: { 0 }, { comm = "lttng-sessiond", tid = 1181, runtime = 1015313, vruntime = 36976733240 }
     [23:21:56.989818514] (+0.000008521) hrtimer_expire_exit: { 0 }, { hrtimer = 3993812192 }
     [23:21:56.989819631] (+0.000001117) hrtimer_expire_exit: { 1 }, { hrtimer = 3993865440 }
     [23:21:56.989821866] (+0.000002235) hrtimer_start: { 0 }, { hrtimer = 3993812192, function = 3238465232, expires = 79815981000000, softexpires = 79815981000000 }
     [23:21:56.989822984] (+0.000001118) hrtimer_start: { 1 }, { hrtimer = 3993865440, function = 3238465232, expires = 79815981000000, softexpires = 79815981000000 }
     [23:21:56.989832762] (+0.000009778) softirq_entry: { 1 }, { vec = 1 }
     [23:21:56.989833879] (+0.000001117) softirq_entry: { 0 }, { vec = 1 }
     [23:21:56.989838069] (+0.000004190) timer_cancel: { 1 }, { timer = 3993871956 }
     [23:21:56.989839187] (+0.000001118) timer_cancel: { 0 }, { timer = 3993818708 }
     [23:21:56.989841492] (+0.000002305) timer_expire_entry: { 1 }, { timer = 3993871956, now = 79515980, function = 3238277552 }
     [23:21:56.989842819] (+0.000001327) timer_expire_entry: { 0 }, { timer = 3993818708, now = 79515980, function = 3238277552 }
     [23:21:56.989854831] (+0.000012012) sched_stat_runtime: { 1 }, { comm = "lttng-consumerd", tid = 1193, runtime = 49237, vruntime = 43368363335 }
     [23:21:56.989855949] (+0.000001118) sched_stat_runtime: { 0 }, { comm = "lttng-sessiond", tid = 1181, runtime = 45121, vruntime = 36976778361 }
     [23:21:56.989861257] (+0.000005308) sched_stat_sleep: { 1 }, { comm = "kworker/1:1", tid = 21, delay = 9451318 }
     [23:21:56.989862374] (+0.000001117) sched_stat_sleep: { 0 }, { comm = "kworker/0:0", tid = 4, delay = 9958820 }
     [23:21:56.989868241] (+0.000005867) sched_wakeup: { 0 }, { comm = "kworker/0:0", tid = 4, prio = 120, success = 1, target_cpu = 0 }
     [23:21:56.989869358] (+0.000001117) sched_wakeup: { 1 }, { comm = "kworker/1:1", tid = 21, prio = 120, success = 1, target_cpu = 1 }
     [23:21:56.989877460] (+0.000008102) timer_expire_exit: { 1 }, { timer = 3993871956 }
     [23:21:56.989878577] (+0.000001117) timer_expire_exit: { 0 }, { timer = 3993818708 }
     .
     .
     .
You can now safely destroy the trace session (note that this doesn't delete the trace - it's still there in ~/lttng-traces):
     root@crownbay:~# lttng destroy
     Session auto-20121015-232120 destroyed at /home/root
Note that the trace is saved in a directory of the same name as returned by 'lttng create', under the ~/lttng-traces directory (note that you can change this by supplying your own name to 'lttng create'):
     root@crownbay:~# ls -al ~/lttng-traces
     drwxrwx---    3 root     root          1024 Oct 15 23:21 .
     drwxr-xr-x    5 root     root          1024 Oct 15 23:57 ..
     drwxrwx---    3 root     root          1024 Oct 15 23:21 auto-20121015-232120
For LTTng userspace tracing, you need to have a properly instrumented userspace program. For this example, we'll use the 'hello' test program generated by the lttng-ust build.
The 'hello' test program isn't installed on the rootfs by the lttng-ust build, so we need to copy it over manually. First cd into the build directory that contains the hello executable:
$ cd build/tmp/work/core2-poky-linux/lttng-ust/2.0.5-r0/git/tests/hello/.libs
Copy that over to the target machine:
$ scp hello root@192.168.1.20:
You now have the instrumented lttng 'hello world' test program on the target, ready to test.
First, from the host, ssh to the target:
     $ ssh -l root 192.168.1.47
     The authenticity of host '192.168.1.47 (192.168.1.47)' can't be established.
     RSA key fingerprint is 23:bd:c8:b1:a8:71:52:00:ee:00:4f:64:9e:10:b9:7e.
     Are you sure you want to continue connecting (yes/no)? yes
     Warning: Permanently added '192.168.1.47' (RSA) to the list of known hosts.
     root@192.168.1.47's password:
Once on the target, use these steps to create a trace:
     root@crownbay:~# lttng create
     Session auto-20190303-021943 created.
     Traces will be written in /home/root/lttng-traces/auto-20190303-021943
Enable the events you want to trace (in this case all userspace events):
     root@crownbay:~# lttng enable-event --userspace --all
     All UST events are enabled in channel channel0
Start the trace:
     root@crownbay:~# lttng start
     Tracing started for session auto-20190303-021943
Run the instrumented hello world program:
     root@crownbay:~# ./hello
     Hello, World!
     Tracing...  done.
And then stop the trace after awhile or after running a particular workload that you want to trace:
     root@crownbay:~# lttng stop
     Tracing stopped for session auto-20190303-021943
You can now view the trace in text form on the target:
     root@crownbay:~# lttng view
     [02:31:14.906146544] (+?.?????????) hello:1424 ust_tests_hello:tptest: { cpu_id = 1 }, { intfield = 0, intfield2 = 0x0, longfield = 0, netintfield = 0, netintfieldhex = 0x0, arrfield1 = [ [0] = 1, [1] = 2, [2] = 3 ], arrfield2 = "test", _seqfield1_length = 4, seqfield1 = [ [0] = 116, [1] = 101, [2] = 115, [3] = 116 ], _seqfield2_length = 4,  seqfield2 = "test", stringfield = "test", floatfield = 2222, doublefield = 2, boolfield = 1 }
     [02:31:14.906170360] (+0.000023816) hello:1424 ust_tests_hello:tptest: { cpu_id = 1 }, { intfield = 1, intfield2 = 0x1, longfield = 1, netintfield = 1, netintfieldhex = 0x1, arrfield1 = [ [0] = 1, [1] = 2, [2] = 3 ], arrfield2 = "test", _seqfield1_length = 4, seqfield1 = [ [0] = 116, [1] = 101, [2] = 115, [3] = 116 ], _seqfield2_length = 4, seqfield2 = "test", stringfield = "test", floatfield = 2222, doublefield = 2, boolfield = 1 }
     [02:31:14.906183140] (+0.000012780) hello:1424 ust_tests_hello:tptest: { cpu_id = 1 }, { intfield = 2, intfield2 = 0x2, longfield = 2, netintfield = 2, netintfieldhex = 0x2, arrfield1 = [ [0] = 1, [1] = 2, [2] = 3 ], arrfield2 = "test", _seqfield1_length = 4, seqfield1 = [ [0] = 116, [1] = 101, [2] = 115, [3] = 116 ], _seqfield2_length = 4, seqfield2 = "test", stringfield = "test", floatfield = 2222, doublefield = 2, boolfield = 1 }
     [02:31:14.906194385] (+0.000011245) hello:1424 ust_tests_hello:tptest: { cpu_id = 1 }, { intfield = 3, intfield2 = 0x3, longfield = 3, netintfield = 3, netintfieldhex = 0x3, arrfield1 = [ [0] = 1, [1] = 2, [2] = 3 ], arrfield2 = "test", _seqfield1_length = 4, seqfield1 = [ [0] = 116, [1] = 101, [2] = 115, [3] = 116 ], _seqfield2_length = 4, seqfield2 = "test", stringfield = "test", floatfield = 2222, doublefield = 2, boolfield = 1 }
     .
     .
     .
You can now safely destroy the trace session (note that this doesn't delete the trace - it's still there in ~/lttng-traces):
     root@crownbay:~# lttng destroy
     Session auto-20190303-021943 destroyed at /home/root
If you already have an LTTng trace on a remote target and would like to view it in Eclipse on the host, you can easily copy it from the target to the host and import it into Eclipse to view it using the LTTng Eclipse plug-in already bundled in the Eclipse (Juno SR1 or greater).
Using the trace we created in the previous section, archive it and copy it to your host system:
     root@crownbay:~/lttng-traces# tar zcvf auto-20121015-232120.tar.gz auto-20121015-232120
     auto-20121015-232120/
     auto-20121015-232120/kernel/
     auto-20121015-232120/kernel/metadata
     auto-20121015-232120/kernel/channel0_1
     auto-20121015-232120/kernel/channel0_0

     $ scp root@192.168.1.47:lttng-traces/auto-20121015-232120.tar.gz .
     root@192.168.1.47's password:
     auto-20121015-232120.tar.gz                                             100% 1566KB   1.5MB/s   00:01
Unarchive it on the host:
     $ gunzip -c auto-20121015-232120.tar.gz | tar xvf -
     auto-20121015-232120/
     auto-20121015-232120/kernel/
     auto-20121015-232120/kernel/metadata
     auto-20121015-232120/kernel/channel0_1
     auto-20121015-232120/kernel/channel0_0
We can now import the trace into Eclipse and view it:
First, start eclipse and open the 'LTTng Kernel' perspective by selecting the following menu item:
Window | Open Perspective | Other...In the dialog box that opens, select 'LTTng Kernel' from the list.
Back at the main menu, select the following menu item:
File | New | Project...In the dialog box that opens, select the 'Tracing | Tracing Project' wizard and press 'Next>'.
Give the project a name and press 'Finish'.
In the 'Project Explorer' pane under the project you created, right click on the 'Traces' item.
Select 'Import..." and in the dialog that's displayed:
Browse the filesystem and find the select the 'kernel' directory containing the trace you copied from the target e.g. auto-20121015-232120/kernel
'Checkmark' the directory in the tree that's displayed for the trace
Below that, select 'Common Trace Format: Kernel Trace' for the 'Trace Type'
Press 'Finish' to close the dialog
Back in the 'Project Explorer' pane, double-click on the 'kernel' item for the trace you just imported under 'Traces'
You should now see your trace data displayed graphically in several different views in Eclipse:
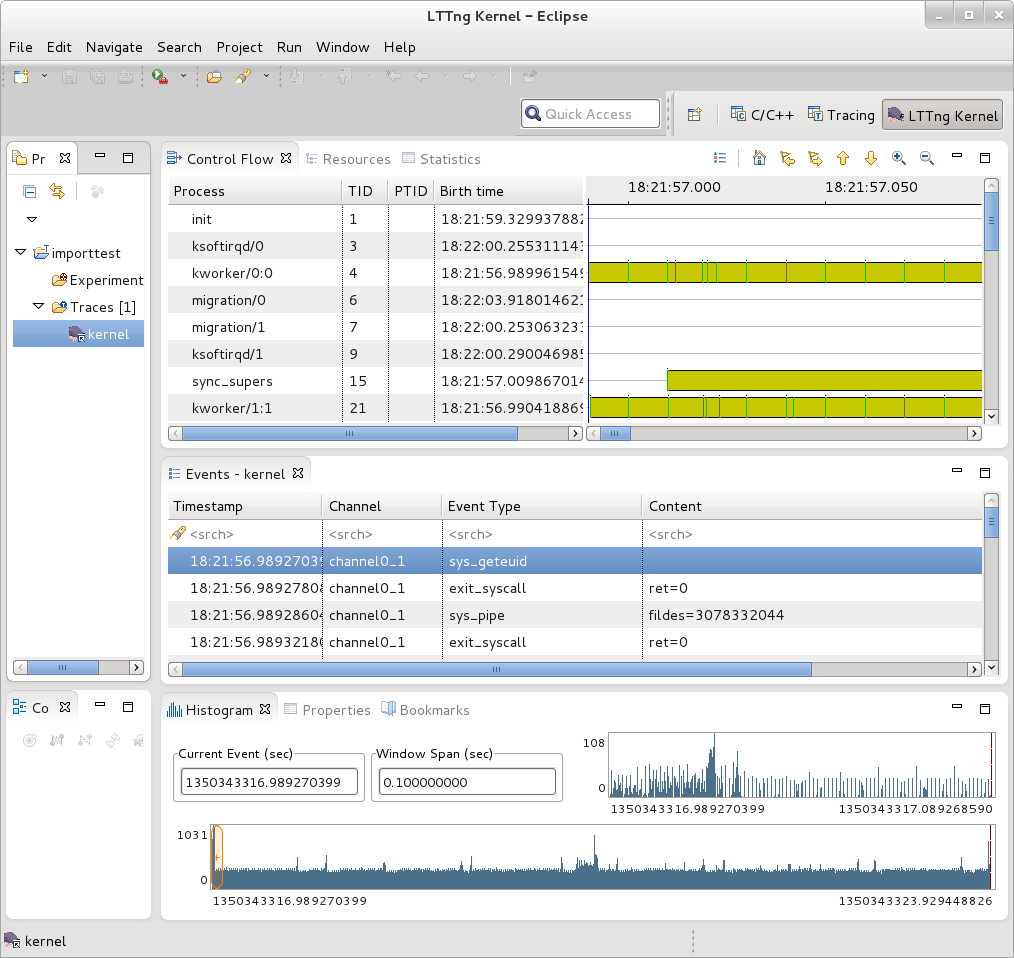 |
You can access extensive help information on how to use the LTTng plug-in to search and analyze captured traces via the Eclipse help system:
Help | Help Contents | LTTng Plug-in User Guide
Note
This section on collecting traces remotely doesn't currently work because of Eclipse 'RSE' connectivity problems. Manually tracing on the target, copying the trace files to the host, and viewing the trace in Eclipse on the host as outlined in previous steps does work however - please use the manual steps outlined above to view traces in Eclipse.In order to trace a remote target, you also need to add a 'tracing' group on the target and connect as a user who's part of that group e.g:
     # adduser tomz
     # groupadd -r tracing
     # usermod -a -G tracing tomz
First, start eclipse and open the 'LTTng Kernel' perspective by selecting the following menu item:
Window | Open Perspective | Other...In the dialog box that opens, select 'LTTng Kernel' from the list.
Back at the main menu, select the following menu item:
File | New | Project...In the dialog box that opens, select the 'Tracing | Tracing Project' wizard and press 'Next>'.
Give the project a name and press 'Finish'. That should result in an entry in the 'Project' subwindow.
In the 'Control' subwindow just below it, press 'New Connection'.
Add a new connection, giving it the hostname or IP address of the target system.
Provide the username and password of a qualified user (a member of the 'tracing' group) or root account on the target system.
Provide appropriate answers to whatever else is asked for e.g. 'secure storage password' can be anything you want. If you get an 'RSE Error' it may be due to proxies. It may be possible to get around the problem by changing the following setting:
Window | Preferences | Network ConnectionsSwitch 'Active Provider' to 'Direct'
There doesn't seem to be any current documentation covering LTTng 2.0, but maybe that's because the project is in transition. The LTTng 2.0 website, however, is here: LTTng Project
You can access extensive help information on how to use the LTTng plug-in to search and analyze captured traces via the Eclipse help system:
Help | Help Contents | LTTng Plug-in User Guide
blktrace is a tool for tracing and reporting low-level disk I/O. blktrace provides the tracing half of the equation; its output can be piped into the blkparse program, which renders the data in a human-readable form and does some basic analysis:
For this section, we'll assume you've already performed the basic setup outlined in the "General Setup" section.
blktrace is an application that runs on the target system. You can run the entire blktrace and blkparse pipeline on the target, or you can run blktrace in 'listen' mode on the target and have blktrace and blkparse collect and analyze the data on the host (see the "Using blktrace Remotely" section below). For the rest of this section we assume you've ssh'ed to the host and will be running blkrace on the target.
To record a trace, simply run the 'blktrace' command, giving it the name of the block device you want to trace activity on:
root@crownbay:~# blktrace /dev/sdc
In another shell, execute a workload you want to trace.
     root@crownbay:/media/sdc# rm linux-2.6.19.2.tar.bz2; wget http://downloads.yoctoproject.org/mirror/sources/linux-2.6.19.2.tar.bz2; sync
     Connecting to downloads.yoctoproject.org (140.211.169.59:80)
     linux-2.6.19.2.tar.b 100% |*******************************| 41727k  0:00:00 ETA
Press Ctrl-C in the blktrace shell to stop the trace. It will display how many events were logged, along with the per-cpu file sizes (blktrace records traces in per-cpu kernel buffers and simply dumps them to userspace for blkparse to merge and sort later).
     ^C=== sdc ===
      CPU  0:                 7082 events,      332 KiB data
      CPU  1:                 1578 events,       74 KiB data
      Total:                  8660 events (dropped 0),      406 KiB data
If you examine the files saved to disk, you see multiple files, one per CPU and with the device name as the first part of the filename:
     root@crownbay:~# ls -al
     drwxr-xr-x    6 root     root          1024 Oct 27 22:39 .
     drwxr-sr-x    4 root     root          1024 Oct 26 18:24 ..
     -rw-r--r--    1 root     root        339938 Oct 27 22:40 sdc.blktrace.0
     -rw-r--r--    1 root     root         75753 Oct 27 22:40 sdc.blktrace.1
To view the trace events, simply invoke 'blkparse' in the directory containing the trace files, giving it the device name that forms the first part of the filenames:
     root@crownbay:~# blkparse sdc

      8,32   1        1     0.000000000  1225  Q  WS 3417048 + 8 [jbd2/sdc-8]
      8,32   1        2     0.000025213  1225  G  WS 3417048 + 8 [jbd2/sdc-8]
      8,32   1        3     0.000033384  1225  P   N [jbd2/sdc-8]
      8,32   1        4     0.000043301  1225  I  WS 3417048 + 8 [jbd2/sdc-8]
      8,32   1        0     0.000057270     0  m   N cfq1225 insert_request
      8,32   1        0     0.000064813     0  m   N cfq1225 add_to_rr
      8,32   1        5     0.000076336  1225  U   N [jbd2/sdc-8] 1
      8,32   1        0     0.000088559     0  m   N cfq workload slice:150
      8,32   1        0     0.000097359     0  m   N cfq1225 set_active wl_prio:0 wl_type:1
      8,32   1        0     0.000104063     0  m   N cfq1225 Not idling. st->count:1
      8,32   1        0     0.000112584     0  m   N cfq1225 fifo=  (null)
      8,32   1        0     0.000118730     0  m   N cfq1225 dispatch_insert
      8,32   1        0     0.000127390     0  m   N cfq1225 dispatched a request
      8,32   1        0     0.000133536     0  m   N cfq1225 activate rq, drv=1
      8,32   1        6     0.000136889  1225  D  WS 3417048 + 8 [jbd2/sdc-8]
      8,32   1        7     0.000360381  1225  Q  WS 3417056 + 8 [jbd2/sdc-8]
      8,32   1        8     0.000377422  1225  G  WS 3417056 + 8 [jbd2/sdc-8]
      8,32   1        9     0.000388876  1225  P   N [jbd2/sdc-8]
      8,32   1       10     0.000397886  1225  Q  WS 3417064 + 8 [jbd2/sdc-8]
      8,32   1       11     0.000404800  1225  M  WS 3417064 + 8 [jbd2/sdc-8]
      8,32   1       12     0.000412343  1225  Q  WS 3417072 + 8 [jbd2/sdc-8]
      8,32   1       13     0.000416533  1225  M  WS 3417072 + 8 [jbd2/sdc-8]
      8,32   1       14     0.000422121  1225  Q  WS 3417080 + 8 [jbd2/sdc-8]
      8,32   1       15     0.000425194  1225  M  WS 3417080 + 8 [jbd2/sdc-8]
      8,32   1       16     0.000431968  1225  Q  WS 3417088 + 8 [jbd2/sdc-8]
      8,32   1       17     0.000435251  1225  M  WS 3417088 + 8 [jbd2/sdc-8]
      8,32   1       18     0.000440279  1225  Q  WS 3417096 + 8 [jbd2/sdc-8]
      8,32   1       19     0.000443911  1225  M  WS 3417096 + 8 [jbd2/sdc-8]
      8,32   1       20     0.000450336  1225  Q  WS 3417104 + 8 [jbd2/sdc-8]
      8,32   1       21     0.000454038  1225  M  WS 3417104 + 8 [jbd2/sdc-8]
      8,32   1       22     0.000462070  1225  Q  WS 3417112 + 8 [jbd2/sdc-8]
      8,32   1       23     0.000465422  1225  M  WS 3417112 + 8 [jbd2/sdc-8]
      8,32   1       24     0.000474222  1225  I  WS 3417056 + 64 [jbd2/sdc-8]
      8,32   1        0     0.000483022     0  m   N cfq1225 insert_request
      8,32   1       25     0.000489727  1225  U   N [jbd2/sdc-8] 1
      8,32   1        0     0.000498457     0  m   N cfq1225 Not idling. st->count:1
      8,32   1        0     0.000503765     0  m   N cfq1225 dispatch_insert
      8,32   1        0     0.000512914     0  m   N cfq1225 dispatched a request
      8,32   1        0     0.000518851     0  m   N cfq1225 activate rq, drv=2
      .
      .
      .
      8,32   0        0    58.515006138     0  m   N cfq3551 complete rqnoidle 1
      8,32   0     2024    58.516603269     3  C  WS 3156992 + 16 [0]
      8,32   0        0    58.516626736     0  m   N cfq3551 complete rqnoidle 1
      8,32   0        0    58.516634558     0  m   N cfq3551 arm_idle: 8 group_idle: 0
      8,32   0        0    58.516636933     0  m   N cfq schedule dispatch
      8,32   1        0    58.516971613     0  m   N cfq3551 slice expired t=0
      8,32   1        0    58.516982089     0  m   N cfq3551 sl_used=13 disp=6 charge=13 iops=0 sect=80
      8,32   1        0    58.516985511     0  m   N cfq3551 del_from_rr
      8,32   1        0    58.516990819     0  m   N cfq3551 put_queue

     CPU0 (sdc):
      Reads Queued:           0,        0KiB	 Writes Queued:         331,   26,284KiB
      Read Dispatches:        0,        0KiB	 Write Dispatches:      485,   40,484KiB
      Reads Requeued:         0		 Writes Requeued:         0
      Reads Completed:        0,        0KiB	 Writes Completed:      511,   41,000KiB
      Read Merges:            0,        0KiB	 Write Merges:           13,      160KiB
      Read depth:             0        	 Write depth:             2
      IO unplugs:            23        	 Timer unplugs:           0
     CPU1 (sdc):
      Reads Queued:           0,        0KiB	 Writes Queued:         249,   15,800KiB
      Read Dispatches:        0,        0KiB	 Write Dispatches:       42,    1,600KiB
      Reads Requeued:         0		 Writes Requeued:         0
      Reads Completed:        0,        0KiB	 Writes Completed:       16,    1,084KiB
      Read Merges:            0,        0KiB	 Write Merges:           40,      276KiB
      Read depth:             0        	 Write depth:             2
      IO unplugs:            30        	 Timer unplugs:           1

     Total (sdc):
      Reads Queued:           0,        0KiB	 Writes Queued:         580,   42,084KiB
      Read Dispatches:        0,        0KiB	 Write Dispatches:      527,   42,084KiB
      Reads Requeued:         0		 Writes Requeued:         0
      Reads Completed:        0,        0KiB	 Writes Completed:      527,   42,084KiB
      Read Merges:            0,        0KiB	 Write Merges:           53,      436KiB
      IO unplugs:            53        	 Timer unplugs:           1

     Throughput (R/W): 0KiB/s / 719KiB/s
     Events (sdc): 6,592 entries
     Skips: 0 forward (0 -   0.0%)
     Input file sdc.blktrace.0 added
     Input file sdc.blktrace.1 added
The report shows each event that was found in the blktrace data, along with a summary of the overall block I/O traffic during the run. You can look at the blkparse manpage to learn the meaning of each field displayed in the trace listing.
blktrace and blkparse are designed from the ground up to be able to operate together in a 'pipe mode' where the stdout of blktrace can be fed directly into the stdin of blkparse:
root@crownbay:~# blktrace /dev/sdc -o - | blkparse -i -
This enables long-lived tracing sessions to run without writing anything to disk, and allows the user to look for certain conditions in the trace data in 'real-time' by viewing the trace output as it scrolls by on the screen or by passing it along to yet another program in the pipeline such as grep which can be used to identify and capture conditions of interest.
There's actually another blktrace command that implements the above pipeline as a single command, so the user doesn't have to bother typing in the above command sequence:
root@crownbay:~# btrace /dev/sdc
Because blktrace traces block I/O and at the same time normally writes its trace data to a block device, and in general because it's not really a great idea to make the device being traced the same as the device the tracer writes to, blktrace provides a way to trace without perturbing the traced device at all by providing native support for sending all trace data over the network.
To have blktrace operate in this mode, start blktrace on the target system being traced with the -l option, along with the device to trace:
     root@crownbay:~# blktrace -l /dev/sdc
     server: waiting for connections...
On the host system, use the -h option to connect to the target system, also passing it the device to trace:
     $ blktrace -d /dev/sdc -h 192.168.1.43
     blktrace: connecting to 192.168.1.43
     blktrace: connected!
On the target system, you should see this:
server: connection from 192.168.1.43
In another shell, execute a workload you want to trace.
     root@crownbay:/media/sdc# rm linux-2.6.19.2.tar.bz2; wget http://downloads.yoctoproject.org/mirror/sources/linux-2.6.19.2.tar.bz2; sync
     Connecting to downloads.yoctoproject.org (140.211.169.59:80)
     linux-2.6.19.2.tar.b 100% |*******************************| 41727k  0:00:00 ETA
When it's done, do a Ctrl-C on the host system to stop the trace:
     ^C=== sdc ===
      CPU  0:                 7691 events,      361 KiB data
      CPU  1:                 4109 events,      193 KiB data
      Total:                 11800 events (dropped 0),      554 KiB data
On the target system, you should also see a trace summary for the trace just ended:
     server: end of run for 192.168.1.43:sdc
     === sdc ===
      CPU  0:                 7691 events,      361 KiB data
      CPU  1:                 4109 events,      193 KiB data
      Total:                 11800 events (dropped 0),      554 KiB data
The blktrace instance on the host will save the target output inside a hostname-timestamp directory:
     $ ls -al
     drwxr-xr-x   10 root     root          1024 Oct 28 02:40 .
     drwxr-sr-x    4 root     root          1024 Oct 26 18:24 ..
     drwxr-xr-x    2 root     root          1024 Oct 28 02:40 192.168.1.43-2012-10-28-02:40:56
cd into that directory to see the output files:
     $ ls -l
     -rw-r--r--    1 root     root        369193 Oct 28 02:44 sdc.blktrace.0
     -rw-r--r--    1 root     root        197278 Oct 28 02:44 sdc.blktrace.1
And run blkparse on the host system using the device name:
     $ blkparse sdc

      8,32   1        1     0.000000000  1263  Q  RM 6016 + 8 [ls]
      8,32   1        0     0.000036038     0  m   N cfq1263 alloced
      8,32   1        2     0.000039390  1263  G  RM 6016 + 8 [ls]
      8,32   1        3     0.000049168  1263  I  RM 6016 + 8 [ls]
      8,32   1        0     0.000056152     0  m   N cfq1263 insert_request
      8,32   1        0     0.000061600     0  m   N cfq1263 add_to_rr
      8,32   1        0     0.000075498     0  m   N cfq workload slice:300
      .
      .
      .
      8,32   0        0   177.266385696     0  m   N cfq1267 arm_idle: 8 group_idle: 0
      8,32   0        0   177.266388140     0  m   N cfq schedule dispatch
      8,32   1        0   177.266679239     0  m   N cfq1267 slice expired t=0
      8,32   1        0   177.266689297     0  m   N cfq1267 sl_used=9 disp=6 charge=9 iops=0 sect=56
      8,32   1        0   177.266692649     0  m   N cfq1267 del_from_rr
      8,32   1        0   177.266696560     0  m   N cfq1267 put_queue

     CPU0 (sdc):
      Reads Queued:           0,        0KiB	 Writes Queued:         270,   21,708KiB
      Read Dispatches:       59,    2,628KiB	 Write Dispatches:      495,   39,964KiB
      Reads Requeued:         0		 Writes Requeued:         0
      Reads Completed:       90,    2,752KiB	 Writes Completed:      543,   41,596KiB
      Read Merges:            0,        0KiB	 Write Merges:            9,      344KiB
      Read depth:             2        	 Write depth:             2
      IO unplugs:            20        	 Timer unplugs:           1
     CPU1 (sdc):
      Reads Queued:         688,    2,752KiB	 Writes Queued:         381,   20,652KiB
      Read Dispatches:       31,      124KiB	 Write Dispatches:       59,    2,396KiB
      Reads Requeued:         0		 Writes Requeued:         0
      Reads Completed:        0,        0KiB	 Writes Completed:       11,      764KiB
      Read Merges:          598,    2,392KiB	 Write Merges:           88,      448KiB
      Read depth:             2        	 Write depth:             2
      IO unplugs:            52        	 Timer unplugs:           0

     Total (sdc):
      Reads Queued:         688,    2,752KiB	 Writes Queued:         651,   42,360KiB
      Read Dispatches:       90,    2,752KiB	 Write Dispatches:      554,   42,360KiB
      Reads Requeued:         0		 Writes Requeued:         0
      Reads Completed:       90,    2,752KiB	 Writes Completed:      554,   42,360KiB
      Read Merges:          598,    2,392KiB	 Write Merges:           97,      792KiB
      IO unplugs:            72        	 Timer unplugs:           1

     Throughput (R/W): 15KiB/s / 238KiB/s
     Events (sdc): 9,301 entries
     Skips: 0 forward (0 -   0.0%)
You should see the trace events and summary just as you would have if you'd run the same command on the target.
It's also possible to trace block I/O using only trace events subsystem, which can be useful for casual tracing if you don't want to bother dealing with the userspace tools.
To enable tracing for a given device, use /sys/block/xxx/trace/enable, where xxx is the device name. This for example enables tracing for /dev/sdc:
root@crownbay:/sys/kernel/debug/tracing# echo 1 > /sys/block/sdc/trace/enable
Once you've selected the device(s) you want to trace, selecting the 'blk' tracer will turn the blk tracer on:
     root@crownbay:/sys/kernel/debug/tracing# cat available_tracers
     blk function_graph function nop

     root@crownbay:/sys/kernel/debug/tracing# echo blk > current_tracer
Execute the workload you're interested in:
root@crownbay:/sys/kernel/debug/tracing# cat /media/sdc/testfile.txt
And look at the output (note here that we're using 'trace_pipe' instead of trace to capture this trace - this allows us to wait around on the pipe for data to appear):
     root@crownbay:/sys/kernel/debug/tracing# cat trace_pipe
                 cat-3587  [001] d..1  3023.276361:   8,32   Q   R 1699848 + 8 [cat]
                 cat-3587  [001] d..1  3023.276410:   8,32   m   N cfq3587 alloced
                 cat-3587  [001] d..1  3023.276415:   8,32   G   R 1699848 + 8 [cat]
                 cat-3587  [001] d..1  3023.276424:   8,32   P   N [cat]
                 cat-3587  [001] d..2  3023.276432:   8,32   I   R 1699848 + 8 [cat]
                 cat-3587  [001] d..1  3023.276439:   8,32   m   N cfq3587 insert_request
                 cat-3587  [001] d..1  3023.276445:   8,32   m   N cfq3587 add_to_rr
                 cat-3587  [001] d..2  3023.276454:   8,32   U   N [cat] 1
                 cat-3587  [001] d..1  3023.276464:   8,32   m   N cfq workload slice:150
                 cat-3587  [001] d..1  3023.276471:   8,32   m   N cfq3587 set_active wl_prio:0 wl_type:2
                 cat-3587  [001] d..1  3023.276478:   8,32   m   N cfq3587 fifo=  (null)
                 cat-3587  [001] d..1  3023.276483:   8,32   m   N cfq3587 dispatch_insert
                 cat-3587  [001] d..1  3023.276490:   8,32   m   N cfq3587 dispatched a request
                 cat-3587  [001] d..1  3023.276497:   8,32   m   N cfq3587 activate rq, drv=1
                 cat-3587  [001] d..2  3023.276500:   8,32   D   R 1699848 + 8 [cat]
And this turns off tracing for the specified device:
root@crownbay:/sys/kernel/debug/tracing# echo 0 > /sys/block/sdc/trace/enable
Online versions of the man pages for the commands discussed in this section can be found here:
The above manpages, along with manpages for the other blktrace utilities (btt, blkiomon, etc) can be found in the /doc directory of the blktrace tools git repo:
$ git clone git://git.kernel.dk/blktrace.git
Table of Contents
This chapter contains real-world examples.
In one of our previous releases (denzil), users noticed that booting off of a live image and writing to disk was noticeably slower. This included the boot itself, especially the first one, since first boots tend to do a significant amount of writing due to certain post-install scripts.
The problem (and solution) was discovered by using the Yocto tracing tools, in this case 'perf stat', 'perf script', 'perf record' and 'perf report'.
See all the unvarnished details of how this bug was diagnosed and solved here: Yocto Bug #3049